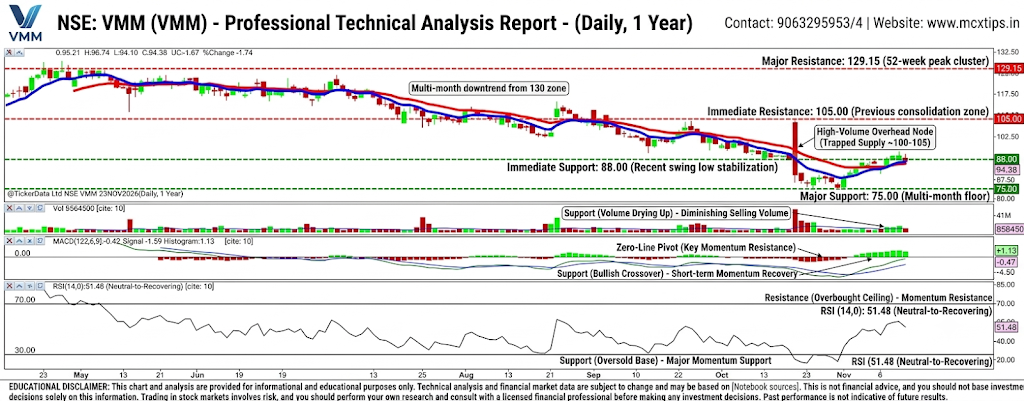





1. Price Action & Moving Averages (Main Chart)
- Current Trend: The stock is trading around 94.38, recovering off its recent 52-week swing low near 82.50 – 85.00. It has moved back up to test its short-term moving average lines (blue and red), attempting to establish a consolidation floor after a multi-month downtrend from the 125.00 – 130.00 zone.
- Support Levels:
- Immediate Support ($85.00 – $88.00): Aligns with the recent swing low stabilization zone where buying demand emerged.
- Major Support ($75.00 – $80.00): Multi-month structural baseline and psychological floor.
- Resistance Levels:
- Immediate Resistance ($102.50 – $105.00): Intermediate breakdown level and previous lower-high consolidation zone.
- Major Resistance ($120.00 – $129.15): Upper supply cluster representing 52-week peak levels and major overhead selling pressure.
2. Volume Indicator
- Current Status: Daily volume is recorded at 8,584,500.
- Support / Resistance via Volume:
- Support (Volume Drying Up): The recent low-to-moderate volume consolidation near the 90.00 – 95.00 range indicates diminishing selling volume.
- Resistance (High-Volume Overhead Nodes): A major volume spike observed during the late October sell-off reflects heavy trapped supply around the 100.00 – 105.00 zone, acting as immediate overhead resistance.
3. MACD Indicator (Moving Average Convergence Divergence)
- Setting: MACD (12, 26, 9)
- Current Status: MACD line is at -0.47, Signal line at -1.59, with a positive histogram reading of +1.13.
- Support / Zero-Line Dynamics:
- Support (Bullish Crossover): The MACD line crossing above the signal line with green histogram expansion highlights short-term momentum recovery off the lower baseline.
- Resistance (Zero-Line Pivot): The 0.00 baseline serves as key overhead momentum resistance. A sustained push across the zero line is required to validate a broader trend reversal.
4. RSI Indicator (Relative Strength Index)
- Setting: RSI (14, 0)
- Current Status: Standing in neutral-to-recovering territory at 51.48, rising from oversold conditions.
- Support / Resistance via RSI:
- Support (Oversold Base): The 25.00 – 30.00 boundary acts as major structural momentum support where past sell-offs hit exhaustion.
- Resistance (Overbought Ceiling): The 65.00 – 70.00 region serves as momentum resistance where previous rallies encountered selling pressure.