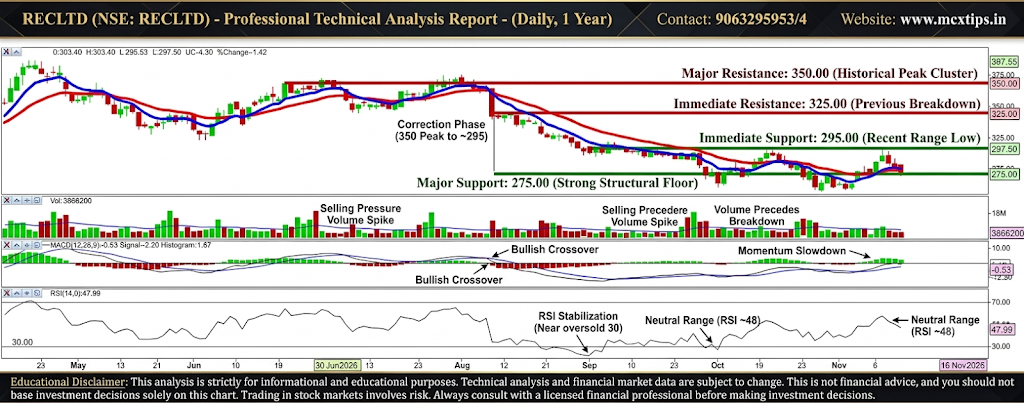





RECLTD based on the provided daily chart and indicators
1. Price Action & Moving Averages (Main Chart)
- Current Trend: The stock has been in a broader corrective downtrend following its mid-2026 peak, but is currently showing short-term stabilization and attempting a modest recovery near the moving average lines (blue/red lines) around 297.50.
- Support Levels:
- Immediate Support ($280 – $290$): Aligns with recent swing lows and immediate consolidation floors.
- Major Support ($260 – $270$): Historical structural demand zone from prior multi-month lows.
- Resistance Levels:
- Immediate Resistance ($310 – $325$): Intermediate supply zone and previous breakdown area marked by the declining moving averages.
- Major Resistance ($350 – $375$): Upper boundary representing heavy overhead selling pressure from previous peaks.
2. Volume Indicator
- Current Status: Daily volume is currently recorded around 3,868,200.
- Support / Resistance via Volume:
- Support (Volume Drying Up): Low-to-moderate volume during the recent consolidation phase suggests that aggressive selling pressure is fading.
- Resistance (High-Volume Overhead Nodes): Spikes in volume during prior downward distribution phases represent trapped overhead supply, acting as resistance barriers during any relief rally.
3. MACD Indicator (Moving Average Convergence Divergence)
- Setting: MACD (12, 26, 9)
- Current Status: MACD line is at -0.53, Signal line at -2.20, with a positive histogram reading of +1.67, reflecting improving short-term momentum.
- Support / Zero-Line Dynamics:
- Support (Histogram Expansion): The positive histogram tick above the signal line indicates that downside selling momentum is actively decelerating.
- Resistance (Zero-Line Pivot): The 0.00 baseline acts as major overhead momentum resistance. A sustained move above zero is required to confirm a broader trend reversal.
4. RSI Indicator (Relative Strength Index)
- Setting: RSI (14, 0)
- Current Status: Neutral-to-recovering territory, sitting at 47.99.
- Support / Resistance via RSI:
- Support (Oversold Floor): The 30.00 level serves as a key historical structural support boundary where bearish momentum typically exhausts.
- Resistance (Overbought Ceiling): The upper boundary region near 60 – 70 serves as major momentum resistance where buying pressure often stalls.