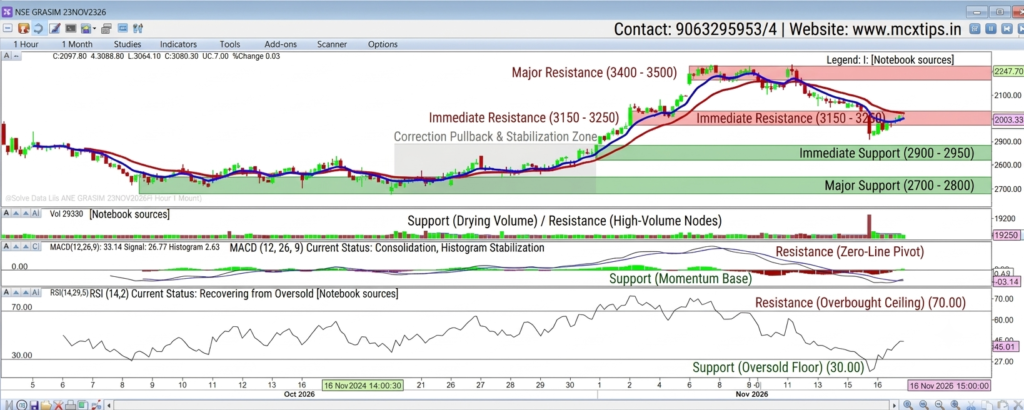





1. Price Action & Moving Averages (Main Chart)
- Current Trend: The stock recently underwent a sharp corrective pullback from its upper peak levels, followed by a slight stabilization and bounce attempt near the short-term moving average lines (blue and red lines).
- Support Levels:
- Immediate Support ($2,900 – $2,950$): Aligns with the recent swing low and minor consolidation floor where buyers stepped in.
- Major Support ($2,700 – $2,800$): Historical structural baseline and key demand zone from prior multi-week bases.
- Resistance Levels:
- Immediate Resistance ($3,150 – $3,250$): Intermediate supply zone and previous breakdown area marked by the declining moving averages.
- Major Resistance ($3,400 – $3,500$): Upper boundary representing heavy overhead supply from previous multi-month highs.
2. MACD Indicator (Moving Average Convergence Divergence)
- Setting: MACD (12, 26, 9)
- Current Status: The MACD line is below the signal line, though histogram bars are showing signs of stabilization.
- Support / Zero-Line Dynamics:
- Support (Momentum Base): The lower negative excursion zone acts as a momentum stabilization floor where selling pressure decelerates.
- Resistance (Zero-Line Pivot): The 0.00 baseline serves as major overhead momentum resistance. A bullish crossover above the signal line and a sustained move back above zero are needed to confirm a trend reversal.
3. RSI Indicator (Relative Strength Index)
- Setting: RSI (14, 2)
- Current Status: Recovering from recent near-oversold territory, currently sitting in the mid-range.
- Support / Resistance via RSI:
- Support (Oversold Floor): The 30.00 level acts as a key structural support boundary where bearish momentum typically exhausts.
- Resistance (Overbought Ceiling): The 70.00 level serves as major momentum resistance where buying pressure frequently stalls.
4. Volume Indicator
- Current Status: Volume remains subdued with occasional spikes during directional moves.
- Support / Resistance via Volume:
- Support (Drying Volume): Low-to-moderate volume during recent consolidation suggests that aggressive selling pressure is drying up.
- Resistance (High-Volume Nodes): Spikes in volume during prior sharp sell-offs indicate trapped overhead supply, acting as resistance barriers during relief rallies