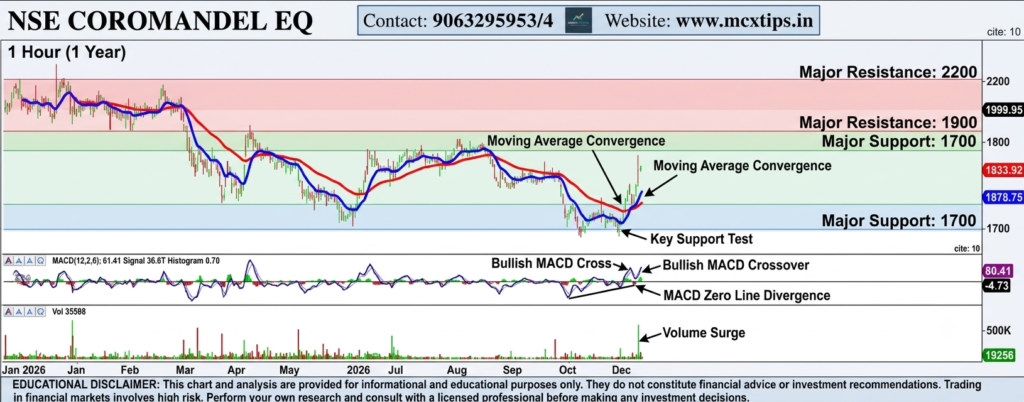





1. Price Action & Moving Averages (Main Chart)
- Current Trend: The chart shows a multi-week/multi-month corrective downward phase with recent attempts to bounce, as prices cross back above the short-term moving average lines (blue/red lines on the main chart).
- Support Levels:
- Immediate Support ($1,750 – 1,8001,8001,800): Recent swing low stabilization area where buying interest emerged.
- Major Support ($1,600 – 1,7001,7001,700): Historical structural floor and significant demand zone from prior lows.
- Resistance Levels:
- Immediate Resistance ($2,050 – 2,1502,1502,150): Intermediate supply zone and previous breakdown area marked by declining moving averages.
- Major Resistance ($2,300 – 2,4502,4502,450): Upper boundary and major overhead supply zone representing previous multi-month peaks.
2. MACD Indicator (Moving Average Convergence Divergence)
- Setting: MACD (12, 26, 9) image_efe382.png
- Current Status: The MACD line is slightly above the signal line with positive histogram bars, reflecting short-term bullish momentum recovery.
- Support / Zero-Line Dynamics:
- Support (Histogram / Signal Crossover): The positive histogram expansion acts as a short-term momentum support, indicating that downside pressure has temporarily abated.
- Resistance (Zero-Line Pivot): The 0.00 baseline and surrounding overhead resistance lines serve as key structural barriers. A sustained move and stabilization well above the zero line are required to confirm a larger trend reversal.
3. Volume Indicator
- Setting: Volume (Hourly/Daily aggregated view) image_efe382.png
- Support / Resistance via Volume:
- Support (Volume Base): Current low-to-moderate volume consolidation near recent lows indicates that aggressive selling pressure is drying up.
- Resistance (High-Volume Overhead Nodes): Spikes in volume during prior downward reversals represent heavy trapped volume and overhead supply, acting as resistance barriers during any upward relief rally.