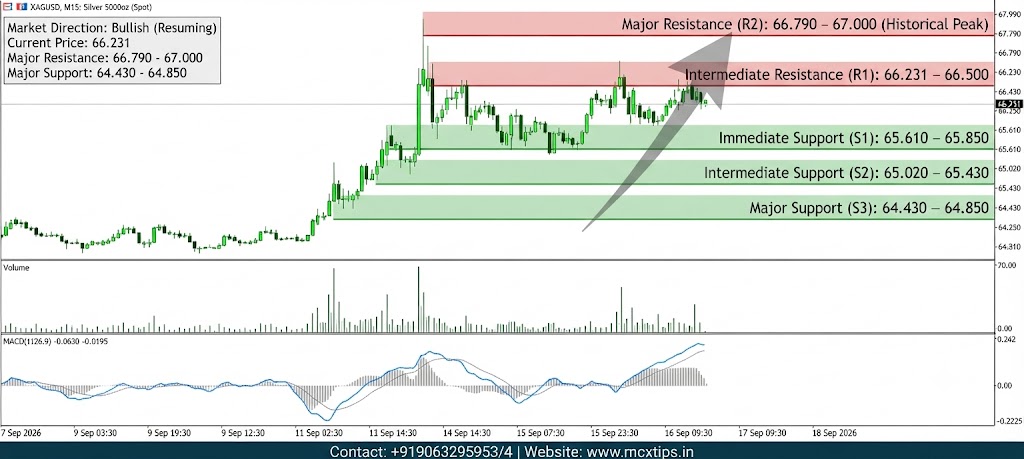
Here is the technical analysis breakdown for XAGUSD (Silver 5000oz Spot) on the 15-minute timeframe:
Market Direction
- Short-Term: Bullish (Resuming)
- Market Status: The price action demonstrates a strong recovery off recent lows, establishing an impulsive upward leg followed by a local consolidation near the highs. Buyers are successfully defending higher levels, showing continuation potential after breaking out of the prior corrective structure.
Support & Resistance Levels
| Level Type | Price Zone / Point | Significance |
|---|---|---|
| Major Resistance (R2) | 66.790 – 67.000 | The major multi-session peak zone and psychological barrier. Breaking through this level opens up space toward higher historical targets. |
| Intermediate Resistance (R1) | 66.231 – 66.500 | The immediate overhead barrier corresponding to recent local swing highs. |
| Current Price / Pivot | 66.231 | The current equilibrium level where price is consolidating right beneath intermediate resistance. |
| Immediate Support (S1) | 65.610 – 65.850 | A critical short-term demand zone. Holding this level is essential to keep the current bullish continuation intact. |
| Intermediate Support (S2) | 65.020 – 65.430 | A deeper structural base and prior consolidation range from earlier swings. |
| Major Support (S3) | 64.430 – 64.850 | The major baseline floor established during previous capitulation or deep pullbacks. |
Indicator Summary
- Price Action: Impulsive green candles pushing into upper ranges with shallow pullbacks, signaling sustained buying pressure.
- RSI (14): Hovering in healthy bullish territory, pointing upward without entering overbought extremes yet, leaving room for further upside.
- MACD: The MACD line remains positioned above the signal line with positive histogram bars, validating the prevailing short-term upward momentum.
Disclaimer: This analysis is strictly for informational and educational purposes and does not constitute financial advice.