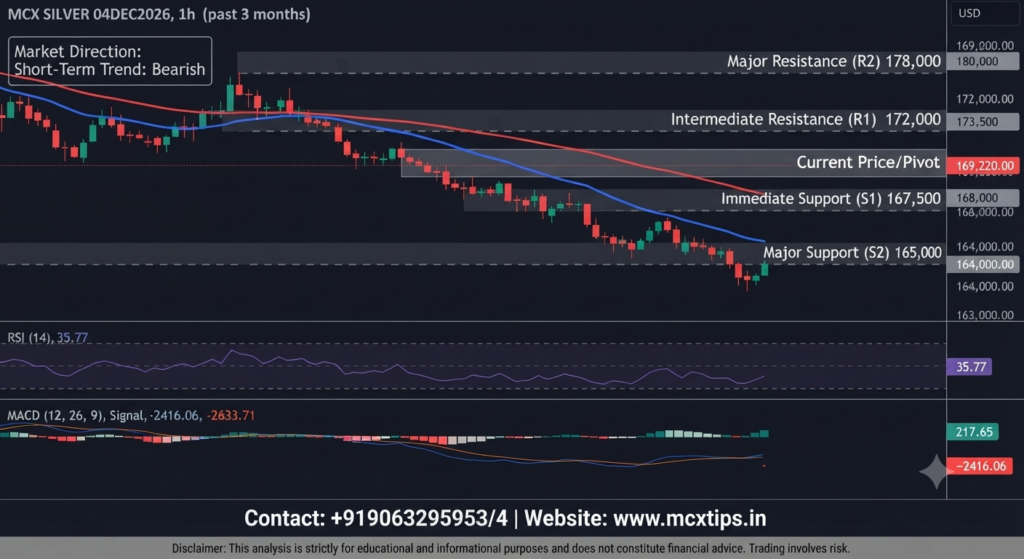





Market Direction
- Short-Term Trend: Bearish
- Analysis: The price action is entrenched in a steady, sustained downtrend from the highs near 211,861, consistently printing lower highs and lower lows. Both the short-term (blue) and long-term (red) moving averages are sloping downward above the current price action, confirming strong seller dominance. The market is currently trading at 169,220.00, attempting a minor stabilization just above recent session lows.
Support & Resistance Levels
| Level Type | Price / Zone | Description & Significance |
| Major Resistance (R2) | 178,000 – 180,000 | Structural breakdown zone and psychological ceiling aligning with prior consolidation lows. |
| Intermediate Resistance (R1) | 172,000 – 173,500 | Immediate overhead supply zone and confluence point with the downward-sloping moving averages. |
| Current Price / Pivot | 169,220.00 | Immediate market equilibrium point testing the lower boundary of the recent decline. |
| Immediate Support (S1) | 167,500 – 168,000 | Crucial immediate floor aligning with the recent multi-session swing lows (L: 167936.0000). |
| Major Support (S2) | 164,000 – 165,000 | Next major psychological and structural demand zone if the immediate floor breaks down. |
Key Technical Indicators Overview
- Moving Averages (Blue & Red Lines): The price remains pinned below both downward-trending moving averages (with the faster blue line positioned below the slower red line), acting as dynamic overhead resistance on any minor pullbacks.
- RSI [14]: Currently sitting at 35.77, recovering slightly from oversold territory below 30.00. This reflects strong bearish momentum while signaling that the asset is approaching oversold extremes, which may prompt short-term relief bounces or sideways consolidation.
- MACD [12, 26, 9]: Remains deep in negative territory ($MACD: -2416.06, Signal: -2633.71, Histogram: 217.65$). While the positive histogram and recent bullish crossover indicate a slight deceleration in immediate downward velocity, the overall trend bias stays firmly negative well below the zero line.
Contact: +919063295953/4 | Website: www.mcxtips.in
Disclaimer: This analysis is strictly for educational and informational purposes and does not constitute financial advice. Trading involves risk.