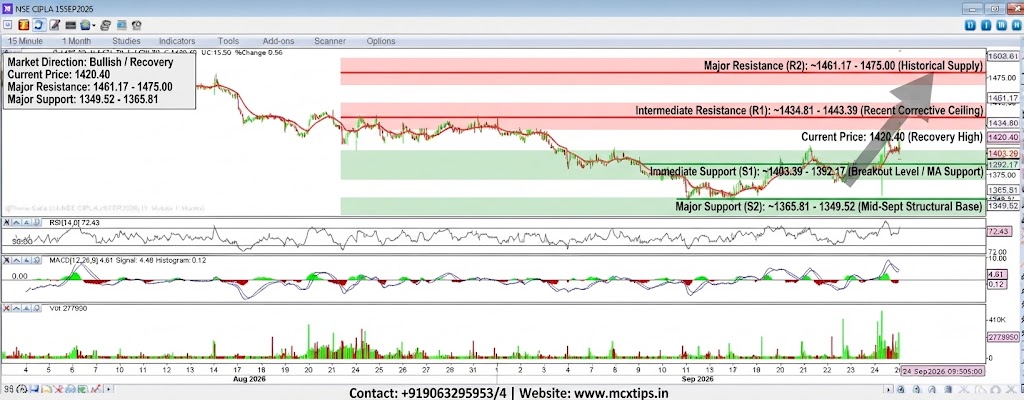


Based on the technical analysis chart provided for NSE CIPLA (15-Minute Timeframe), here is the breakdown of the market direction and key support/resistance levels:
Market Direction
- Short-Term: Bullish / Recovery Phase. After finding a major structural bottom around the mid-September lows (~1349 – 1365 range), the stock has experienced a steady recovery, breaking above its short-term moving average with recent impulsive green candles pushing the price toward the 1420.40 level.
Support & Resistance Levels
| Level Type | Price / Zone | Description & Significance |
|---|---|---|
| Major Resistance (R2) | ~1461.17 – 1475.00 | Upper structural ceiling from prior historical swings and major overhead supply. |
| Intermediate Resistance (R1) | ~1434.81 – 1443.39 | Recent corrective ceiling and immediate barrier to ongoing upside momentum. |
| Current Price / Pivot | 1420.40 | The immediate market equilibrium point tracking the latest session recovery. |
| Immediate Support (S1) | ~1403.39 – 1392.17 | Confluence of recent breakout levels and the rising moving average acting as dynamic support. |
| Major Support (S2) | ~1365.81 – 1349.52 | Strong multi-week structural demand base established in mid-September. |
Indicator Snapshot
- Moving Average (Red): Price is currently tracking above the moving average line, supporting the near-term bullish recovery bias.
- RSI [14]: Hovering near the 72.43 mark, pointing toward firm momentum, though approaching near-term overbought conditions.
- MACD [12, 26, 9]: Positive histogram readings (
0.12) with lines positioned above the zero baseline, confirming ongoing buying pressure.
Contact: +919063295953/4 | Website: www.mcxtips.in
Disclaimer: This analysis is for educational and informational purposes only and does not constitute financial advice.