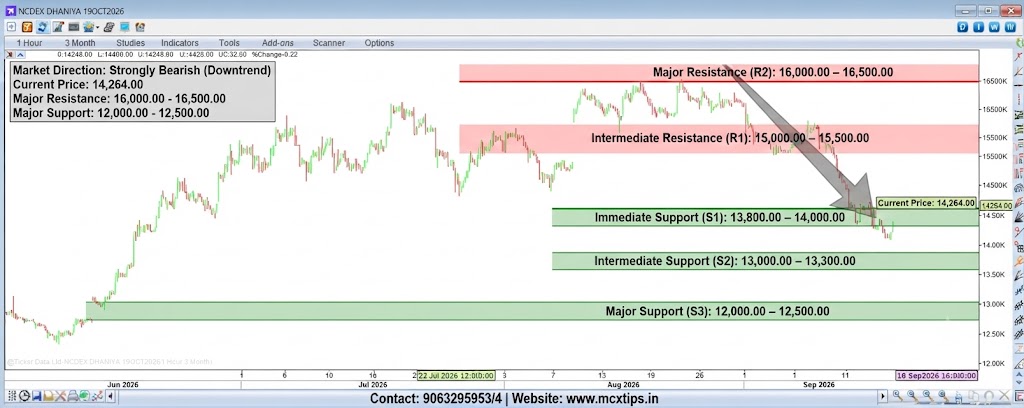
NCDEX DHANIYA 19OCT2026 (1-Hour timeframe, 3-Month view), here is a detailed breakdown of market direction and support/resistance levels.
Market Direction
- Medium-to-Long Term: Bearish / Downtrend. The broader chart structure displays a sharp rejection from highs near the 16,500K–16,800K region, followed by a persistent sequence of lower highs and lower lows.
- Short Term: Strongly Bearish. The price action shows a recent aggressive impulsive sell-off, breaking down below key intermediate levels to trade near 14,264.00 (down 32.00 or 0.22%), with sellers maintaining full dominance.
Support & Resistance Analysis
| Level Type | Price Range / Zone | Description & Technical Significance |
| Major Resistance (R2) | 16,000.00 – 16,500.00 | Major multi-month ceiling and primary supply zone where heavy distribution occurred. |
| Intermediate Resistance (R1) | 15,000.00 – 15,500.00 | Previous consolidation floor that has now inverted into strong overhead resistance. |
| Current Price / Pivot | 14,264.00 | The immediate market equilibrium point as the price attempts to stabilize after the steep drop. |
| Immediate Support (S1) | 13,800.00 – 14,000.00 | Immediate psychological demand floor and potential cushion against further downside. |
| Intermediate Support (S2) | 13,000.00 – 13,300.00 | Significant historical swing low zone established earlier in the contract cycle. |
| Major Support (S3) | 12,000.00 – 12,500.00 | Deep structural support base and long-term multi-month low baseline. |
Disclaimer: This analysis is for informational purposes only and does not constitute financial advice.