





Based on the multi-indicator analysis of the 15-minute timeframe chart for MCX Natural Gas (28JUL2026 Contract), the commodity displays a mature, well-defined bearish micro-structure. Traders tracking this asset should evaluate the prevailing market mechanics across three dimensions: core trend, current trade direction, and structural price coordinates.
1. Market Trend & Directional Bias
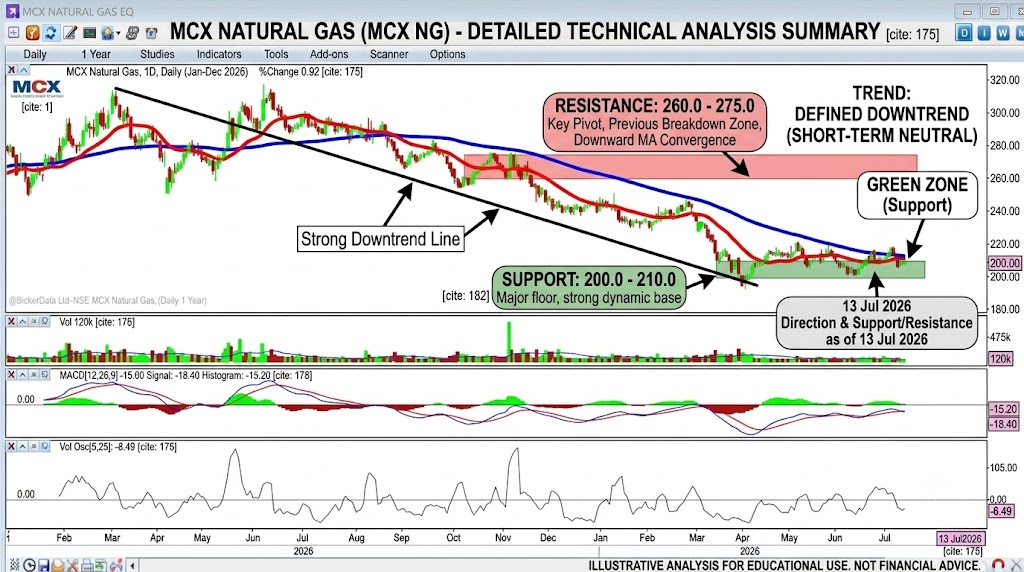
- Primary Trend: Defined Downtrend The asset exhibits a textbook structural downtrend over the observed period. Price action is strictly characterized by a sequence of lower highs and lower lows. The price candles remain pinned beneath both the short-term red moving average and the medium-term blue moving average lines. Because these averages are sloped firmly downward, they act as active, dynamic ceilings that choke out minor intraday recovery attempts.
- Trade Direction: Short (Bearish) The tactical bias remains securely positioned for short opportunities. Any momentary price reflex upward currently functions as a relief rally within a broader distribution phase, rather than a structural reversal.
2. Supporting Momentum Indicators
- MACD (Moving Average Convergence Divergence): The MACD line ($12, 26, 9$) sits marginally in positive territory ($\approx 0.42$), while the histogram prints green bars at $0.4472$. While this notes a subtle flattening out of immediate selling pressure—indicative of minor, low-conviction base building—the signal lines lack the sharp upward velocity required to challenge the heavy overhead moving averages.
- Volume Oscillator & Open Interest (OI): The Volume Oscillator registers deep in negative territory at $-32.37\%$, revealing that the recent sideways grinding occurs on diminishing transactional volume. Meanwhile, the consistent, dense green bars in the lower Open Interest panel ($\approx 37,215$ contracts) demonstrate that overall institutional positioning remains highly active and locked into the broader downtrend structure.
3. Key Technical Levels
To properly structuralize risk management, two distinct zones on the chart dictate the immediate macro path:
    [Resistance Zone: 285.00 – 290.00]
    ▲  (Major Ceiling / Historical Breakdown Point)
    │
    │   ◄─── [Current Price: 279.20] (Consolidating Under MAs)
    │
    ▼
    [Support Zone: 270.00 – 273.00]
    (Psychological Floor / Target Expansion Zone)
- Immediate Resistance Corridor: 285.00 – 290.00 This region marks a major structural pivot zone. It represents the localized breakdown origin point where aggressive sellers initially flushed the market down. Additionally, the descending blue moving average line converges directly into this space, making it a formidable technical supply ceiling.
- Immediate Support Baseline: 270.00 – 273.00 If the current consolidation under the moving averages breaks to the downside, the price is projected to search out this psychological value floor. Expect buyers to attempts to defend this zone, marking it as a logical target location for active short exposures.
Strategic Outlook
The asset is currently undergoing brief contraction/consolidation near its lows at 279.20. Until the price prints a definitive closing sequence back above the dynamic moving average cluster, the path of least resistance points downward. Aggressive counter-trend buying remains highly risky under these configurations.
Disclaimer: This technical analysis is generated for educational and illustrative purposes only. Commodity markets involve substantial risk due to leverage and volatility. This does not constitute formal financial advice. Always perform personal due diligence or consult a registered financial professional before managing real capital.