





Overall Directional Bias
The overall trend is Strongly Bullish (Upward).
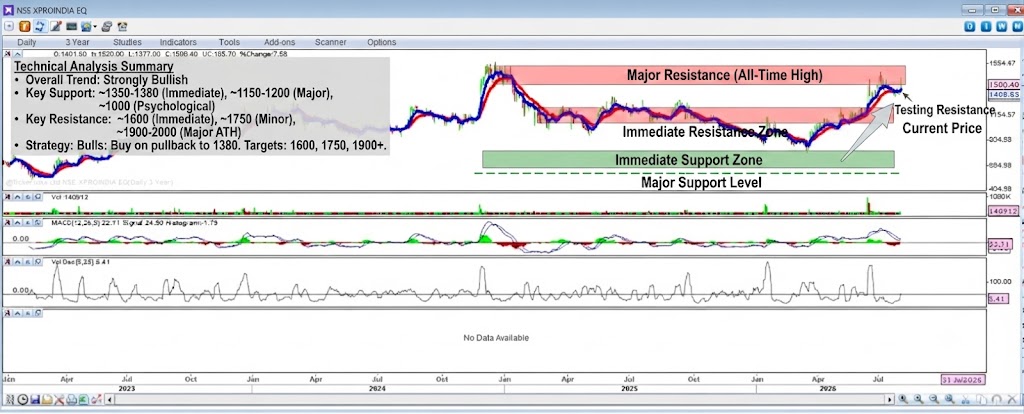
- Price Action: The stock has been in a multi-year uptrend, characterized by a series of higher highs and higher lows. After a significant correction throughout much of 2025, the price found support and has recently resumed its upward trajectory, breaking out of a consolidation phase to create a new recent high. The price is currently trading near the top of its range at 1500.40.
- Moving Averages: Both the short-term (red) and long-term (blue) moving averages are sloping upwards and are fanned out, confirming the strength of the bullish trend. The price is trading comfortably above both averages, which now act as dynamic support.
- Indicators:
- MACD: The MACD line is well above the signal line, and the histogram is positive and expanding, indicating strong and accelerating bullish momentum.
- Volume Oscillator: The volume oscillator shows spikes of high volume on the recent price surges, confirming strong buying interest and institutional participation.
Conclusion on Direction: The market is firmly under the control of the bulls. The path of least resistance is to the upside, and any short-term pullback is likely to be a buying opportunity.
Support Levels (Downside Targets)
These are key levels where buying interest could emerge, potentially halting or reversing any decline.
- Immediate Support: ~1350 – ~1380 This zone represents the recent consolidation range top and the level where the short-term (red) moving average is currently converging. The price is now well above this, making it a solid near-term floor.
- Major Support: ~1150 – ~1200 This is a significant structural support level, representing the major historical breakout point before the massive rally in 2024 and again acting as support during the 2025 correction. A drop to this level would offer a high-probability buying opportunity.
- Psychological Support: ~1000 A major round-number level that should act as a very strong long-term psychological floor.
Resistance Levels (Upside Barriers)
These are key levels where selling pressure is likely to increase, potentially pausing or reversing an upward move.
- Immediate Resistance: ~1600 This is the next significant psychological and round-number resistance level above the current price.
- Minor Resistance: ~1750 Farther up, this level has acted as both support and resistance in the past, creating a “memory” level where sellers may re-emerge.
- Major Resistance (All-Time High): ~1900 – ~2000 This is the ultimate near-to-medium term target and major resistance zone. A decisive break above this level would signal the next major leg of the multi-year uptrend.
Summary Strategy
- Bullish Stance: The bias is firmly bullish. Traders could look to enter long positions on any minor pullback to the ~1380 immediate support zone, with a tight stop-loss just below 1350. An alternative conservative strategy is to wait for a confirmed daily close above the ~1600 immediate resistance to confirm the resumption of the uptrend, targeting 1750 and then 1900.
- Risk Caution: While the trend is strong, the stock is extended. Chasing the price at current levels (1500) offers a poor risk-to-reward ratio compared to buying near support. A failure to hold above the moving averages would be the first sign of a trend weakening.
Disclaimer: This technical analysis is for informational purposes only and does not constitute financial advice. Trading involves risk, including the loss of principal. Please conduct your own research or consult a professional financial advisor before making any trading decisions.
for more updates join our whatsapp group https://chat.whatsapp.com/Jrj3abV2S945BqYiQzOdk9