





Overall Directional Bias
The overall trend is Strongly Bullish (Upward).
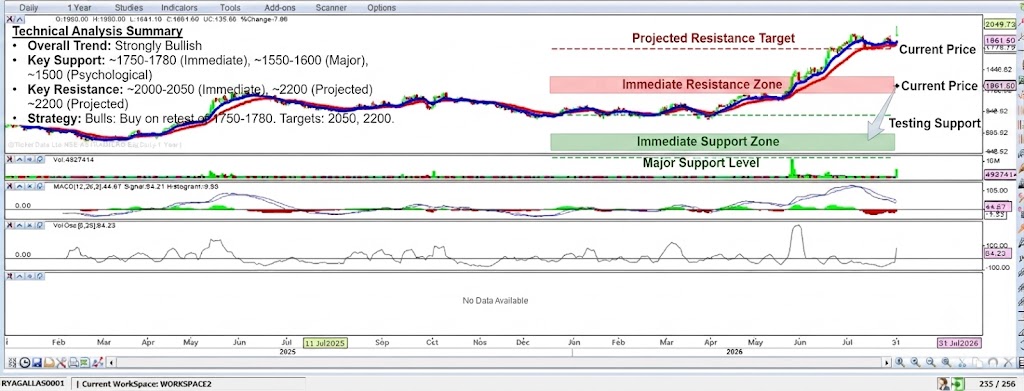
- Price Action: The chart displays a clear, powerful multi-year uptrend. After a period of consolidation (roughly between 1000 and 1300 throughout late 2025 and early 2026), the stock broke out sharply to the upside. It has recently established a new multi-year high around 2049 and is currently trading at approximately 1861.60. This is a slight pullback from the recent high, which is typical after such a strong rally.
- Moving Averages: Both the short-term (red) and long-term (blue) moving averages are sloping sharply upwards and are fanned out, confirming the strength and acceleration of the bullish trend. The price is trading well above both averages, which now act as dynamic support.
- Indicators:
- MACD: The MACD line is well above the signal line, and the histogram is positive and expanding, indicating strong and accelerating bullish momentum.
- Volume Oscillator: The volume oscillator shows significant spikes of high volume that coincide with the price breakouts, confirming strong institutional buying interest.
Conclusion on Direction: The market is firmly under the control of the bulls. The path of least resistance is to the upside, and any short-term pullback is likely to be a buying opportunity.
Support Levels (Downside Targets)
These are key levels where buying pressure is likely to emerge, potentially halting or reversing any decline.
- Immediate Support: ~1750 – ~1780 This zone represents the recent minor swing high before the final push to the 2049 peak. The price is currently approaching this area, and a hold here would be a very bullish sign.
- Major Support: ~1550 – ~1600 Farther down, this zone is a significant structural support level, representing the confluence of the short-term (red) moving average and prior price action. A drop to this level would be a deeper correction but would offer a high-probability buying opportunity for longer-term investors.
- Psychological Support: ~1500 A major round-number level that should act as a significant psychological floor for the market.
Resistance Levels (Upside Barriers)
These are key levels where selling pressure is likely to increase, potentially pausing or reversing an upward move.
- Immediate Resistance: ~2000 – ~2050 This is the first and most obvious psychological and historical resistance zone, corresponding to the recent multi-year high. The stock will likely face considerable selling pressure here on its first retest.
- Projected Resistance: ~2200 Using a measured move based on the prior consolidation range (1000-1300), a breakout target can be projected towards the 2200 level.
Summary Strategy
- Bullish Stance: The bias is firmly bullish. Traders could look to enter long positions on a successful retest and bounce from the ~1750-1780 immediate support zone, with a stop-loss just below 1730. An alternative strategy is to wait for a confirmed break above the ~2050 recent high to confirm the resumption of the uptrend, targeting 2200.
- Risk Caution: While the trend is strong, the stock is extended. A failure to hold the ~1750 support could lead to a deeper correction toward the ~1550 major support. Chasing the price at current levels (1861) offers a poor risk-to-reward ratio compared to buying near support.
Disclaimer: This technical analysis is for informational purposes only and does not constitute financial advice. Markets are volatile and can change direction quickly. Please conduct your own research or consult a financial advisor before making any trading decisions.
for more updates join our whatsapp group https://chat.whatsapp.com/Jrj3abV2S945BqYiQzOdk9