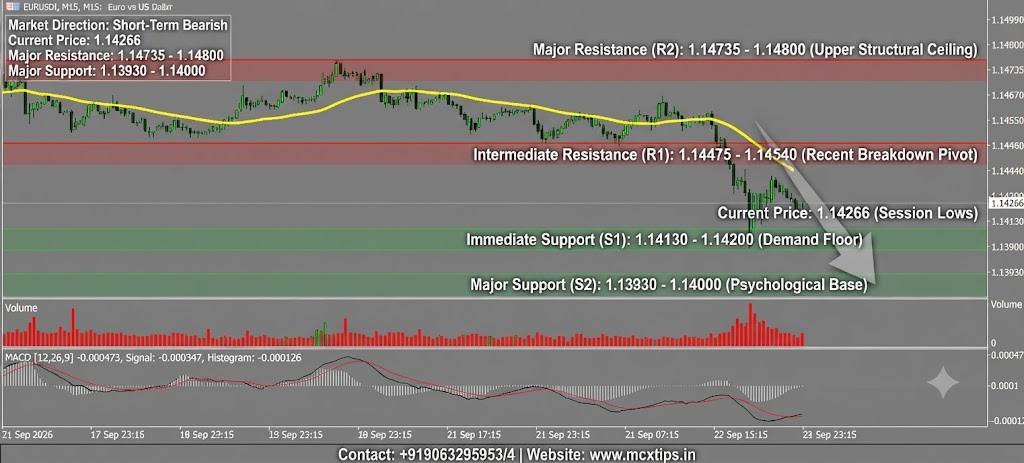
Based on the technical analysis of the provided EURUSD!, M15 (Euro vs US Dollar) chart, here is the detailed breakdown of the market direction, key support and resistance zones, and indicator interpretations:
Market Direction
- Short-Term Trend: Bearish
- Market Status: The pair is in a clear short-term downward trajectory after breaking below previous consolidation ranges. Price action continues to form lower lows and lower highs, trading firmly below the yellow moving average line, which acts as dynamic overhead resistance.
Support & Resistance Levels
| Level Type | Price / Zone | Significance |
| Major Resistance (R2) | 1.14735 – 1.14800 | Upper structural ceiling from prior swing highs. |
| Intermediate Resistance (R1) | 1.14475 – 1.14540 | Recent breakdown pivot level and near-term corrective barrier. |
| Current Price / Pivot | 1.14266 | Immediate market equilibrium point sitting near session lows. |
| Immediate Support (S1) | 1.14130 – 1.14200 | Crucial short-term demand floor tested in the latest sessions. |
| Major Support (S2) | 1.13930 – 1.14000 | Psychological round-number base and extended downside target. |
Indicator Analysis
- Price Action & Moving Average (Yellow): The price is tracking well below the declining moving average. Consecutive red-dominated candles reflect sustained selling pressure without significant buyer intervention.
- MACD [12, 26, 9]: Both the MACD line and the signal line reside in negative territory below the zero baseline, accompanied by expanding histogram bars (current reading around
-0.000473). This confirms persistent and accelerating downward momentum.
Contact: +919063295953/4 | Website: www.mcxtips.in
Disclaimer: This analysis is provided strictly for educational and informational purposes and does not constitute financial advice.