


Overall Trend Analysis (Direction)
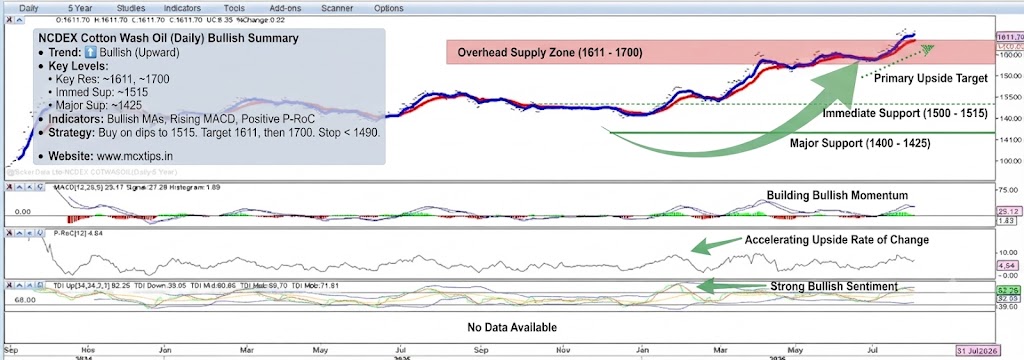
The overall trend for Cotton Wash Oil is Bullish (Upward).
- Price Action: The chart clearly shows a series of higher highs and higher lows, indicating a sustained upward bias. The price is currently trading near its highest level in the observed period. It is comfortably above both the short-term red moving average and the longer-term blue moving average, which are fanned out upwards, confirming the bullish trend. The most recent candles show strong buying pressure with the price closing near its high.
- Indicators:
- MACD: The MACD line is above the signal line, and the histogram is positive and expanding. This signals that bullish momentum is strong and accelerating.
- P-RoC (Percentage Rate of Change): The indicator is positive, indicating that the rate of change of the price is accelerating to the upside, supporting the bullish view.
- TDI (Traders Dynamic Index): The TDI lines are in the overbought territory, and the green (market sentiment) line is well above the red (volatility band) line, confirming strong bullish sentiment and momentum.
Conclusion: The direction is up. The path of least resistance is to the upside, and traders should look for buying opportunities on pullbacks as long as the bullish structure holds.
Support and Resistance Levels
These levels have been derived from recent price action and key points on the chart structure.
Resistance Levels (Upside Barriers)
- Immediate Resistance: ~1611.70 (Current Price / Recent High) The price is currently testing this level, which is the most recent swing high. A decisive break above this level would open the door for further gains.
- Major Resistance: ~1700.00 (Psychological Level) Further up, the major psychological round number of 1700.00 is the next significant overhead supply zone and a key long-term target.
Support Levels (Downside Targets)
- Immediate Support: ~1500.00 – ~1515.00 (Psychological Level / Prior Consolidation High) This zone, which served as a breakout level and is near the major psychological level of 1500.00, is the first line of defense. As long as the price holds above this area, the bullish structure remains intact.
- Major Support: ~1400.00 – ~1425.00 (Prior Consolidation Zone / Moving Average Zone) Below that, this area represents a more significant prior consolidation zone where the price found support before the last leg up. It also aligns with where the longer-term blue moving average is currently converging. A break below this would signal a potential change in trend.
- Deeper Support: ~1300.00 (Psychological Level) Further down, the 1300 psychological level is a major long-term structural support zone.
Summary Strategy:
- The current bias is firmly bullish.
- Short-term traders could look for buying opportunities on minor pullbacks towards the ~1515.00 support level, with a stop-loss just below that level (e.g., ~1490.00), targeting the ~1611.70 resistance level.
- A confirmed break above the ~1611.70 level would be a strong continuation signal, targeting a move towards ~1700.00.
- A breakdown below the ~1400.00 support level would be a significant bearish reversal signal, suggesting a deeper correction.
Disclaimer: This is a technical analysis for informational purposes only and does not constitute financial advice. Markets are volatile and can change direction quickly.