





Based on the provided daily chart for NSE BANKNIFTY, here is a technical analysis of the current direction, support, and resistance levels.
Overall Directional Bias
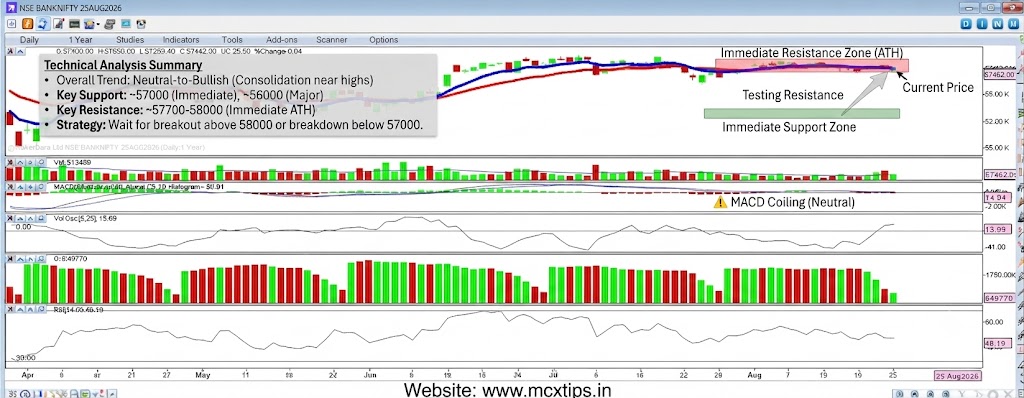
The short-to-medium term trend is Neutral-to-Bullish (Consolidation with a positive tilt).
- Price Action: The index has been in a strong uptrend since late April, making a series of higher highs and higher lows. However, the recent price action from mid-August has been characterized by a period of consolidation or a minor pullback. The price is currently trading near 57462.00, just below the recent all-time highs.
- Moving Averages: The short-term (red) moving average is crossed above the long-term (blue) moving average, which is a bullish signal. Both averages are sloping upwards, confirming the primary uptrend. The price is trading just above these averages, which are now acting as dynamic support.
- Indicators:
- MACD: The MACD line is hovering just above the signal line, and the histogram is nearly flat at the zero line. This reflects a lack of strong momentum in either direction, confirming the recent consolidation phase.
- RSI: The RSI is at 48.19, which is exactly in the “neutral” zone. It has been moving sideways, offering no clear signal of an impending breakout in either direction.
- Volume Oscillator: The volume oscillator is low, suggesting declining volatility and interest, which is typical during a consolidation phase.
- Open Interest: Open interest has been steady, with some recent profit-taking, but no major shift in positions is evident.
Conclusion on Direction: The market is in a “wait-and-see” mode. The bias is slightly bullish because the price is above its moving averages and near its highs, but the lack of strong momentum from the MACD and RSI suggests a catalyst (breakout or breakdown) is needed to determine the next major move.
Support Levels (Downside Targets)
These are key levels where buying interest is likely to emerge.
- Immediate Support: ~57000.00 This is the first and most crucial short-term support zone, representing the recent swing lows in mid-August and the confluence of the short-term (red) moving average. A decisive break below this level would signal a deeper correction.
- Major Support: ~56000.00 – ~56200.00 This is a significant structural support level, representing the location of the previous major breakout point in early August and the current location of the long-term (blue) moving average. A drop to this level would be a deeper correction but would offer a high-probability buying opportunity for longer-term traders.
- Psychological Support: ~55000.00 A major psychological round-number level that served as a significant historical resistance before being broken in late July. It is now a long-term structural support floor.
Resistance Levels (Upside Barriers)
These are key levels where selling pressure is likely to increase.
- Immediate Resistance: ~57700.00 – ~58000.00 This zone is the first major hurdle to the upside. It encompasses the recent all-time highs (around 58000) and the minor swing highs from late August. A break and hold above this level is required to negate the current consolidation pattern and resume the uptrend towards 60000.
- Minor Resistance: ~59000.00 – ~60000.00 Farther up, this level represents a psychological and projected target based on the previous measured move. It will act as a formidable psychological and historical barrier against further upside.
Summary Strategy
- Neutral/Cautious: The market is in consolidation near its highs. Traders may want to avoid entering large positions until a clear breakout occurs from the current ~57000 – ~58000 range.
- Bulls (Waiting for strength): Wait for a confirmed daily close above the ~58000 resistance level before entering long positions. Your initial target would be 59000, with a tight stop-loss just below 57500.
- Bears (Testing the range): Could look for short entries on any bounce that fails near the 57800-58000 area (near the recent highs), with a tight stop-loss just above 58100 and an initial target of 57000. A break below ~57000 would be a more confirmed sell signal, targeting 56000.
Disclaimer: This technical analysis is for informational purposes only and does not constitute financial advice. Trading involves risk, including the loss of principal. Please conduct your own research or consult a professional financial advisor before making any trading decisions.
for more updates join our whatsapp group https://chat.whatsapp.com/Jrj3abV2S945BqYiQzOdk9