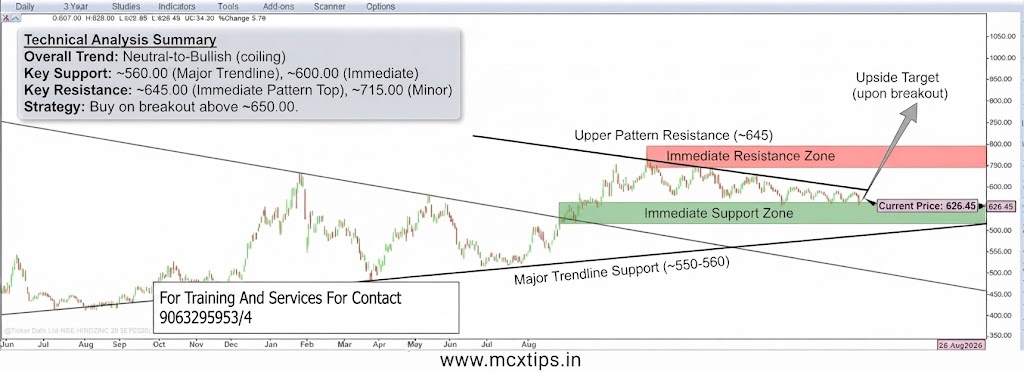
Based on the provided 3-year daily chart for NSE HINDZINC (Hindustan Zinc Ltd), here is an analysis of the current direction, support, and resistance levels.
Overall Directional Bias
The short-to-medium term trend is Neutral-to-Bullish (within a larger Symmetrical Triangle pattern).
- Price Action: The price has been consolidating for over a year, forming a clear Symmetrical Triangle chart pattern (the two converging black lines). The price is currently trading near the middle of this triangle at approximately 626.45.
- Recent Momentum: After finding support at the lower trendline of the triangle around July 2026, the price has made a series of higher lows and is pushing upwards, showing short-term buying pressure.
- Pattern Implications: The price is coiling, and a breakout is expected. A breakout (up or down) from this triangle will determine the next major long-term trend. Given the recent higher low formation, the immediate pressure is towards the upside of the pattern.
Conclusion on Direction: The market is in a “wait-and-see” mode. The bias is slightly positive as it moves away from pattern support, but no clear long-term trend is established until the triangle is resolved.
Support Levels (Downside Targets)
These are key levels where buying interest is likely to emerge.
- Immediate Support: ~580.00 – ~600.00 This zone represents the recent swing low from August 2026 and a minor consolidation area, which is now the first line of defense.
- Major Support (Trendline): ~550.00 – ~560.00 This is the critical lower trendline of the symmetrical triangle. This level has been tested multiple times over the last year and has held. A decisive daily close below this level would be a major bearish breakdown signal.
- Historical Support: ~450.00 – ~460.00 Farther down, this is the significant historical base from the lows of 2025. This is the ultimate medium-term structural support floor.
Resistance Levels (Upside Barriers)
These are key levels where selling pressure is likely to increase.
- Immediate Resistance (Pattern Top): ~640.00 – ~650.00 This zone is the first major hurdle to the upside. It represents the upper descending trendline of the symmetrical triangle and the site of several recent minor swing highs.
- Minor Resistance: ~700.00 – ~730.00 Farther up, this level was the significant swing high from early 2026. A successful breach of the triangle top will target this area next.
- Major Resistance: ~780.00 – ~800.00 This is the major historical resistance level from the peak of 2025. Breaking above this would be a very strong long-term bullish signal.
Summary Strategy
- Neutral/Cautious: The market is coiling. Traders may want to avoid entering large positions until a clear breakout occurs from the ~560.00 – ~650.00 range.
- Bulls (Waiting for confirmation): Wait for a confirmed daily close above the ~650.00 resistance (breaking the triangle) before entering long positions. Your initial target would be 700.00, with a tight stop-loss just below 630.00.
- Swing Traders (Playing the range): Could look for long entries on any bounce that holds near the ~600.00 support, with a tight stop-loss just below 580.00 and an initial target of 640.00. A break below 550.00 would be a confirmed sell signal.
Disclaimer: This technical analysis is for informational purposes only and does not constitute financial advice. Markets are volatile and can change direction quickly. Please conduct your own research or consult a professional financial advisor before making any trading decisions.