1. Market Direction & Trend Analysis
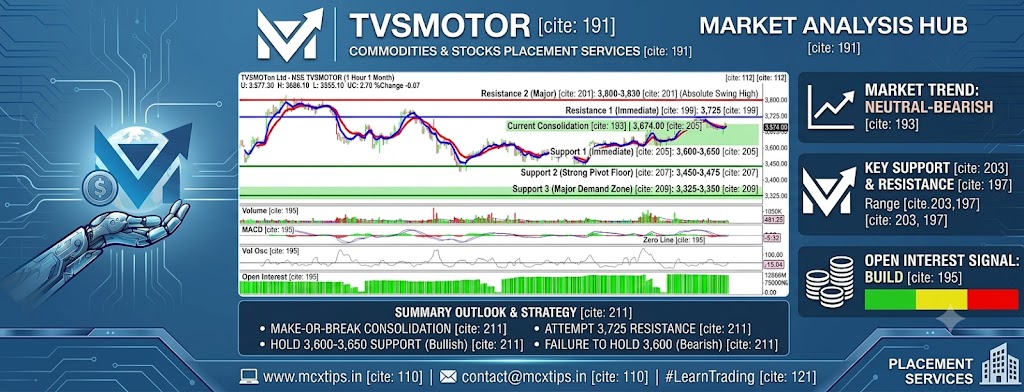
- Short-Term Trend (Neutral to Mildly Bearish): The stock has experienced a recent pullback from its July peak near 3,800. It is currently consolidating just under the moving average ribbon (the red and blue lines on the main chart), showing a minor downward slope.
- Indicators: * MACD: The MACD histogram is hovering near the zero line with a flat signal line, indicating low momentum and a short-term consolidation phase.
- Open Interest (OI) & Volume: Trading volume is relatively steady, but the thick green Open Interest bars at the bottom show significant open positions, implying that market participants are heavily committed at these price levels, building energy for the next major breakout or breakdown.
2. Key Support & Resistance Levels
🛑 Overhead Resistance Levels (Sellers’ Territory)
These are the ceilings where the price has recently faced selling pressure and struggled to break above:
- Resistance 1 (Immediate): 3,725 — This marks the local peak formed in early July where the price consolidated before its latest minor drop. A breakout above this level is needed to shift momentum back to the bulls.
- Resistance 2 (Major): 3,800 – 3,830 — The absolute swing high visible on this 3-month chart. Massive selling pressure sits here, and clearing this zone would open the doors to new highs.
🛡️ Key Support Levels (Buyers’ Territory)
These are the structural floors where buyers have stepped in previously to halt price declines:
- Support 1 (Immediate): 3,600 – 3,650 — The price is currently resting right above this zone (3,674.00). Historically, this region has acted as an interim floor during late June.
- Support 2 (Strong Structural Floor): 3,450 – 3,475 — A critical pivot zone. In early June and late April, the stock repeatedly bounced hard after testing this level.
- Support 3 (Major Demand Zone): 3,325 – 3,350 — The absolute lowest floor established during the mid-May correction. If the broader market experiences a steep selloff, this is the primary zone where heavy institutional buying is expected to emerge.
Summary Outlook
TVSMOTOR is currently in a make-or-break consolidation zone. Holding above the immediate 3,600–3,650 support is vital for the bulls to launch another attempt at the 3,725 resistance. A failure to hold 3,600 could accelerate a slow drift back toward the stronger 3,450 structural floor.