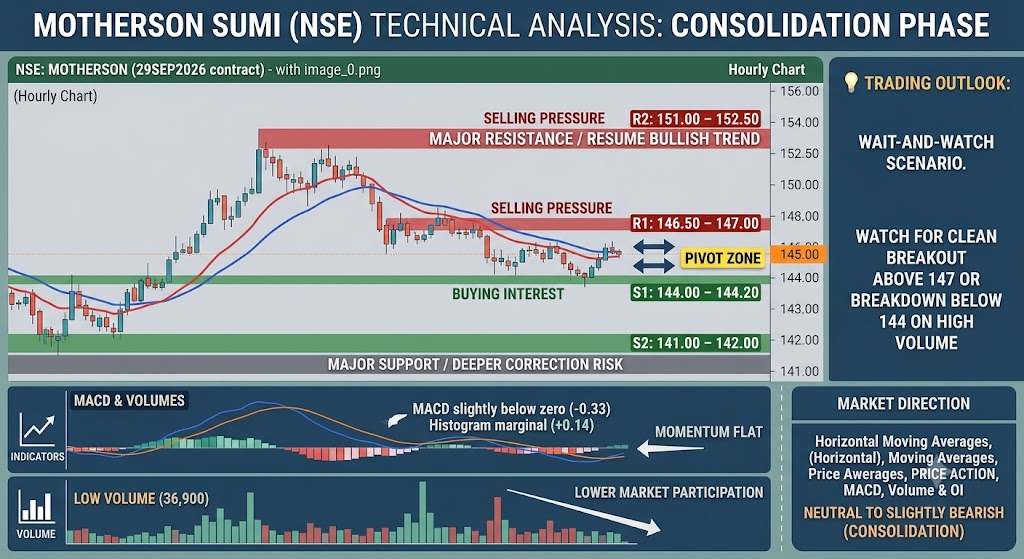

📊 Market Direction: Neutral to Slightly Bearish (Consolidation)
The stock is currently in a sideways consolidation phase with a slight downward bias after correcting from its late June highs.
- Price Action: The price has flattened out significantly through July, sticking closely to the moving averages.
- Moving Averages: The red and blue moving average lines are intertwined and moving horizontally. This indicates a lack of a strong directional trend (sideways market).
- MACD: The MACD is slightly below the zero line (-0.33) but the histogram is marginally positive (0.14). The signal line and MACD line are flat, confirming momentum has dried up.
- Volume & Open Interest (OI): Volume is relatively low (36,900), and OI has dropped significantly compared to late June, showing lower market participation at this current price level.
📈 Support and Resistance Levels
Given the current closing price of 145.00, the key levels to watch based on recent swing highs and lows are:
Resistance Levels (Ceilings)
- Immediate Resistance (R1): 146.50 – 147.00 * This is the recent minor peak in early July where the price faced selling pressure.
- Major Resistance (R2): 151.00 – 152.50 * The prominent swing high established at the end of June. A breakout above this is required to resume a strong bullish trend.
Support Levels (Floors)
- Immediate Support (S1): 144.00 – 144.20 * The low of the current session and where the stock is currently finding buying interest.
- Major Support (S2): 141.00 – 142.00 * The swing low formed around July 7th. If the price breaks below this level, it could trigger a deeper correction toward the late June bottom (~137).
💡 Trading Outlook
Since the stock is moving sideways between 144 and 147, it is currently a “wait-and-watch” scenario. A clean breakout above 147 or a breakdown below 144 on high volume will likely determine the next short-term directional move.