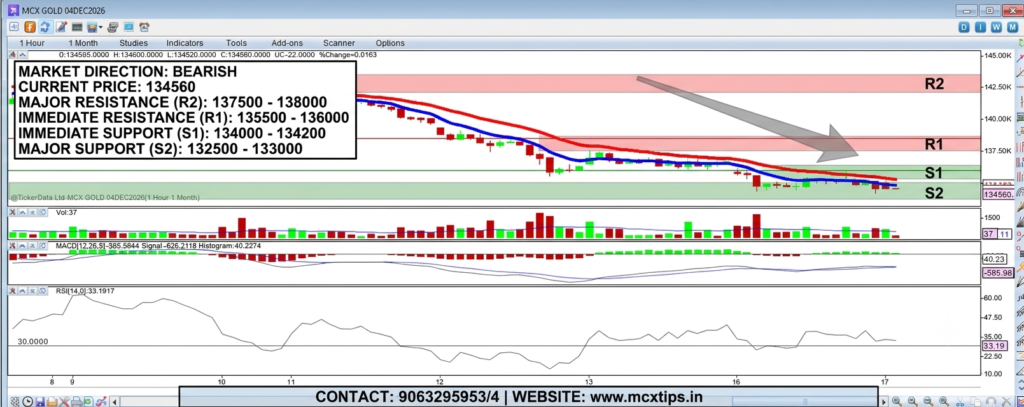





Market Direction
- Short-Term Trend: Bearish
- Analysis: The price action is entrenched in a steady, sustained downtrend from the highs near 144,000, consistently printing lower highs and lower lows. Both the short-term (blue) and long-term (red) moving averages are sloping downward above the current price action, confirming strong seller dominance. The market is currently trading at 134,560.00, hovering just above recent session lows.
Support & Resistance Levels
| Level Type | Price / Zone | Description & Significance |
| Major Resistance (R2) | 137,500 – 138,000 | Structural swing high and psychological ceiling aligning with the upper red moving average resistance. |
| Intermediate Resistance (R1) | 135,500 – 136,000 | Immediate overhead supply zone and confluence point with the downward-sloping moving averages. |
| Current Price / Pivot | 134,560.00 | Immediate market equilibrium point testing the lower boundary of the recent consolidation range. |
| Immediate Support (S1) | 134,000 – 134,200 | Crucial immediate floor aligning with the recent multi-session swing lows. |
| Major Support (S2) | 132,500 – 133,000 | Next major psychological and structural demand zone if the immediate floor breaks down. |
Key Technical Indicators Overview
- Moving Averages (Blue & Red Lines): The price remains pinned below both downward-trending moving averages (with the faster blue line positioned below the slower red line), acting as dynamic overhead resistance on any minor pullbacks.
- RSI [14]: Currently sitting at 33.19, just above the oversold threshold (30.00). This reflects strong bearish momentum while signaling that the asset is approaching oversold territory, which could trigger minor relief bounces or sideways consolidation.
- MACD [12, 26, 9]: Remains deep in negative territory ($MACD: -585.98, Signal: -626.21, Histogram: 40.23$). While the positive histogram indicates a slight deceleration in immediate downward velocity, the overall trend bias stays firmly negative below the zero line.
Contact: +919063295953/4 | Website: www.mcxtips.in
Disclaimer: This analysis is strictly for educational and informational purposes and does not constitute financial advice. Trading involves risk.