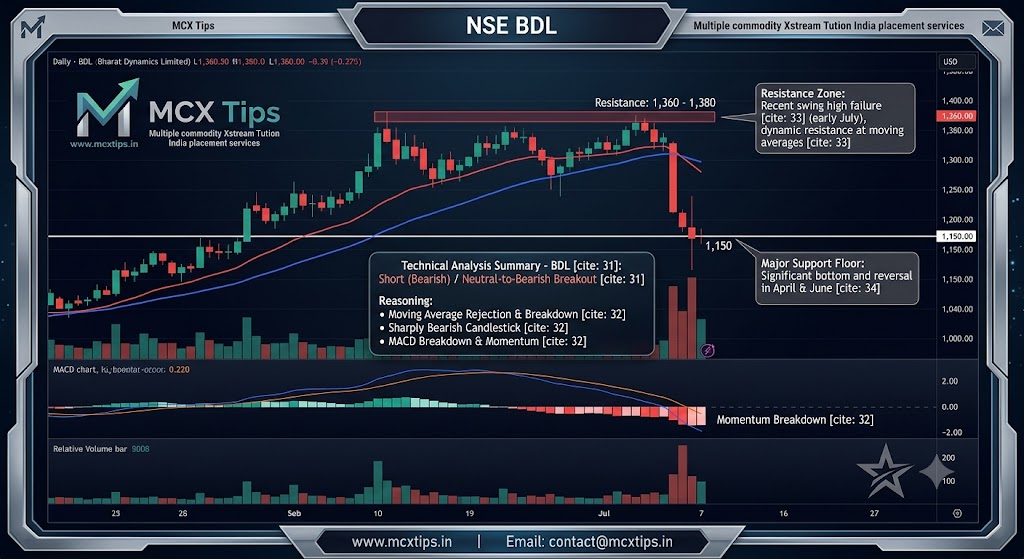
NSE BDL (Bharat Dynamics Limited), here is the technical analysis for the trade direction, support, and resistance:
Technical Analysis Summary
- Trade Direction: Short (Bearish) / Neutral-to-Bearish Breakout
- Reasoning: After a brief recovery in June, the stock faced rejection at the red and blue moving average lines in early July. The most recent daily candlestick shows a sharp, long red body, slicing cleanly below both moving averages with an expansion in volume. Additionally, the MACD histogram has crossed below the zero line into negative territory, and the MACD line is crossing below the signal line, confirming increasing downward momentum.
Key Levels
- Resistance:1,360 – 1,380
- Reasoning: This zone marks the recent swing high where the price tried to break out in early July but failed, aligning closely with the dynamic resistance of the sloping moving averages.
- Support:1,150
- Reasoning: This serves as the major horizontal floor where the price bottomed out and aggressively reversed upward during both April and June.