





Overall Trend Analysis (Direction)
The overall short-term trend is Neutral to Slightly Bearish.
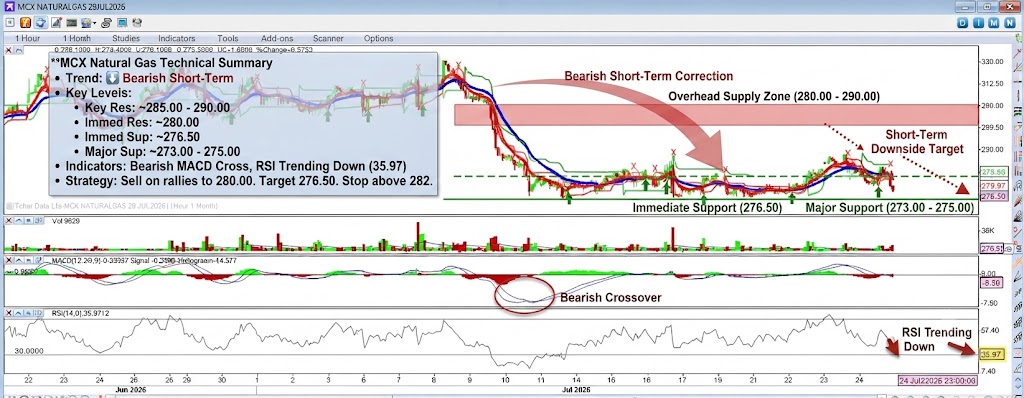
- Price Action: The price is currently in a sideways consolidation phase, marked by a series of relatively flat highs and lows. It is trading just below both the short-term red moving average and the longer-term blue moving average, suggesting a mild bearish tilt. The candles show a lack of strong direction with small bodies and mixed wicks, indicating indecision in the market.
- Indicators:
- MACD: The MACD line is below the signal line, and the histogram is negative and close to zero, indicating waning bullish momentum and a slight downside bias.
- RSI: The RSI is at 42.15 and is sloping downwards. This is in the neutral zone, but it is moving away from the 50 level towards oversold territory, suggesting that selling pressure is slightly increasing.
Conclusion: The direction is slightly down in the immediate term, but the market is essentially range-bound. Traders should look for a break out of this range for the next clear trend.
Support and Resistance Levels
These levels have been derived from recent price action and key psychological points on the chart.
Resistance Levels (Upside Barriers)
- Immediate Resistance: ~346.00 This is the recent swing high and the level where the price has faced temporary selling pressure (visible as the red ‘X’ mark). A break above this level would be a first sign of short-term strength and could lead to a retest of higher levels.
- Key Resistance: ~350.00 This is a significant psychological level and also corresponds to a prior swing high. It will be a major barrier for any bullish move.
- Major Resistance: ~361.47 (Gap Level) This level represents the top of the large gap created at the beginning of the chart’s history. Filling this gap would be a very strong bullish signal.
Support Levels (Downside Targets)
- Immediate Support: ~343.25 This is the most recent swing low. It is the first line of defense for the bulls. A break below this level would signal a continuation of the short-term downtrend.
- Major Support: ~335.00 – ~337.00 This is a key structural support zone where the price has previously found buyers and where the moving averages converged before the last rally. It is a critical area to hold.
- Deeper Support: ~325.00 Below the 335-337 zone, the next major area of interest is the psychological round number of 325.
Summary Strategy:
- The current bias is slightly bearish in the short term.
- Traders looking to sell might consider a short position on a confirmed break below the immediate support of ~343.25, targeting the ~335.00 level. A stop-loss would be placed just above the entry point (e.g., around 345.00).
- Traders looking to buy should be cautious and wait for a clear reversal pattern, such as a break above the immediate resistance of ~346.00, or look for buying opportunities near the major support zone of ~335.00.
Disclaimer: This is a technical analysis for informational purposes only and does not constitute financial advice. Markets are volatile and can change direction quickly.