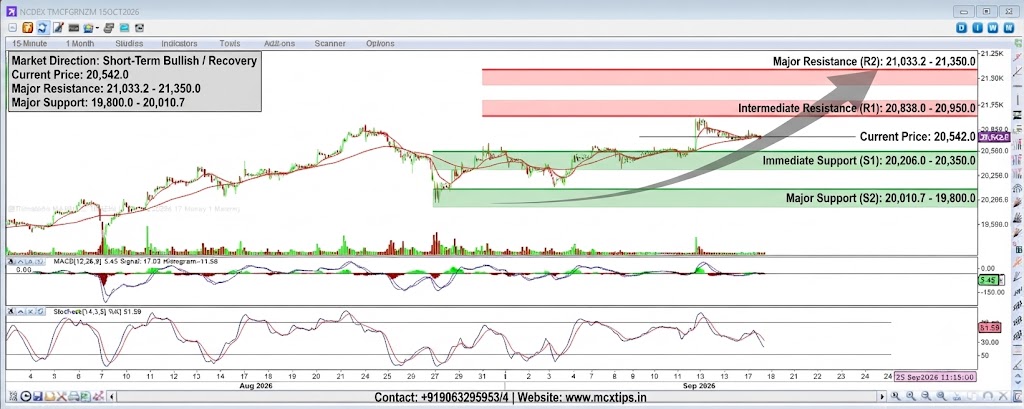


Based on the technical analysis chart provided for NCDEX TMCFGRNZM 16OCT2026 (15-Minute timeframe), here is the detailed breakdown:
Market Direction
- Short-Term Trend: Bullish / Recovery Phase. The price action shows a steady upward push from the mid-September lows, consistently trading above the red moving average line with a series of higher lows. The current price stands around 20,542.0.
Support & Resistance Levels
| Level Type | Price / Zone | Description & Significance |
| Major Resistance (R2) | ~21,033.2 – 21,350.0 | Upper structural ceiling and previous rejection zone from earlier sessions. |
| Intermediate Resistance (R1) | ~20,838.0 – 20,950.0 | Near-term corrective barrier tracking recent swing highs. |
| Current Price / Pivot | 20,542.0 | Immediate market equilibrium point. |
| Immediate Support (S1) | ~20,206.0 – 20,350.0 | Confluence of recent breakout levels and dynamic moving average support. |
| Major Support (S2) | ~20,010.7 – 19,800.0 | Strong structural demand floor established during prior consolidation phases. |
Indicator Snapshot
- Moving Average (Red): The price is tracking above the moving average line, supporting the active short-term upward momentum.
- RSI [14]: Registering around 51.59, indicating a balanced market with room for further upside movement before reaching overbought levels.
- MACD [12, 26, 9]: Displays positive configuration with the MACD line above signal and a positive histogram reading (
11.50), confirming steady buying interest.
Contact: +919063295953/4 | Website: www.mcxtips.in
Disclaimer: This analysis is provided strictly for educational and informational purposes and does not constitute financial advice.