




Overall Trend Analysis (Direction)
The overall trend is Bearish (Downward).
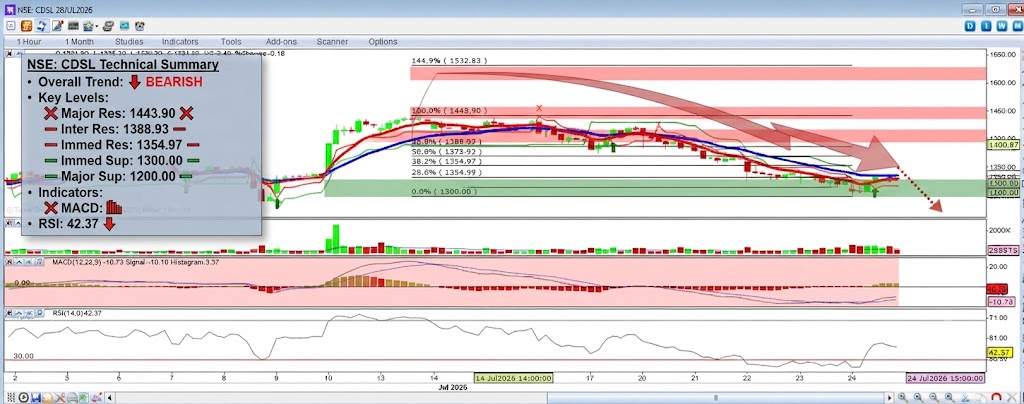
- Price Action: The price has formed a clear series of lower highs and lower lows. The most recent price action shows a sharp breakdown from the consolidation area near the 100% Fibonacci level (1443.90). It is currently trading below both the short-term red moving average and the medium-term blue moving average, which are also trending downwards, confirming the bearish momentum.
- Indicators:
- MACD: The MACD line has crossed below the signal line and is in negative territory. The MACD histogram is showing significant red bars, indicating increasing downward momentum.
- RSI: The RSI is at 42.37 and is sloping downwards. It is not yet in oversold territory (below 30), suggesting there is still room for the price to fall further before a potential bounce.
Conclusion: The direction is down, with strong bearish confirmation from both price action and momentum indicators.
Support and Resistance Levels
These levels have been derived from the Fibonacci retracement/extension levels clearly marked on your chart.
Resistance Levels (Upside Barriers)
- Immediate Resistance: 1354.97 (38.2% Fibonacci) The price is currently just below this level. Any attempt to rally will first face resistance here. A break above this level would be a short-term positive sign.
- Intermediate Resistance: 1388.93 (61.8% Fibonacci) This is a more significant short-term resistance. It is the level where the previous major rally stalled before the final push to the 100% level.
- Major Resistance: 1443.90 (100.0% Fibonacci) This is the major “X” mark and a significant pivot point. To reverse the current bearish trend and turn bullish, the price must convincingly break above this level.
Support Levels (Downside Targets)
- Immediate Support: 1300.00 (0.0% Fibonacci) This is the next major psychological and structural support level. The price is heading towards this point rapidly.
- Major Support: 1200.00 (Estimated -100% Extension) If the price breaks below 1300.00, the next major measured move would be a drop to approximately 1200.00, based on the Fibonacci extension scale visible on the chart.
- Long-Term Support: 1000.00 (Estimated -200% Extension) Further down, the 1000.00 level would be a significant long-term psychological and historical support zone.
Summary Strategy:
- The trend is decisively down.
- Short-term traders might look for selling opportunities on rallies to resistance levels (1354 or 1388) with a stop-loss just above the entry.
- The primary downside target is the 1300.00 level.
- A long position should only be considered if the price shows a strong reversal pattern and manages to reclaim the 1388.93 level and, ideally, the 1443.90 level.
Disclaimer: This is a technical analysis for informational purposes only and does not constitute financial advice. Markets are volatile and can change direction quickly.