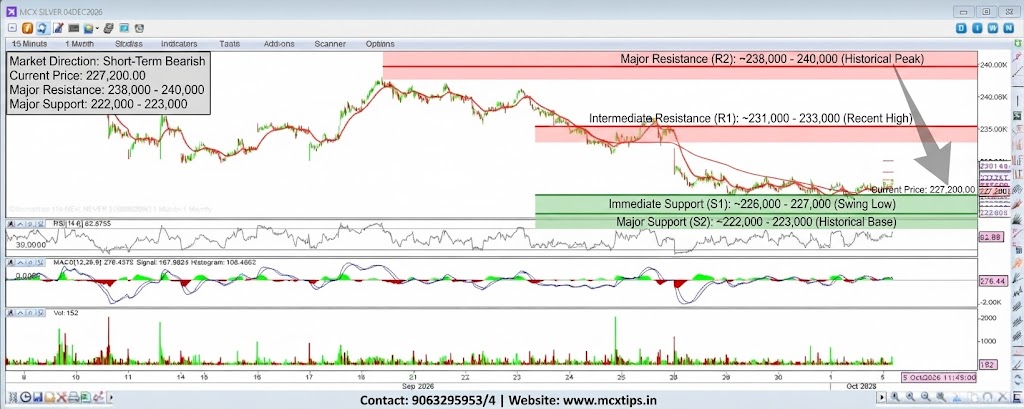



Based on the technical analysis chart for MCX SILVER 04DEC2026 (15-Minute Timeframe), here is the breakdown of the market direction and key support/resistance levels:
Market Direction
- Short-Term Trend: Bearish. The chart shows a dominant short-term downtrend from the intraday peak near the 240.00K level, characterized by a sequence of lower highs and lower lows. The price is currently trading near 227200.00, having recently made a new low before a minor stabilization.
Support & Resistance Levels
| Level Type | Price / Zone | Description & Significance |
| Major Resistance (R2) | ~238,000 – 240,000 | The major psychological level and peak zone from earlier in the session. A break above here would be needed to reverse the short-term downtrend. |
| Intermediate Resistance (R1) | ~231,000 – 233,000 | A significant area of price congestion and the location of recent lower-highs, acting as the immediate overhead barrier. |
| Current Price / Pivot | 227,200.00 | The immediate market equilibrium point. |
| Immediate Support (S1) | ~226,000 – 227,000 | The most recent swing low and immediate demand zone. Holding above this level is key to prevent a deeper decline. |
| Major Support (S2) | ~222,000 – 223,000 | The next significant historical support level and multi-day low base. |
Indicator Snapshot
- Price Action & Moving Average (Red Line): The price is trading well below the downward-sloping red moving average line, confirming the active bearish momentum.
- RSI [14]: At 62.88. This is surprisingly high and nearing overbought territory, indicating that the recent sell-off may be overextended, and there could be potential for a short-term relief rally or consolidation before further downside.
- MACD [12,26,9]: Shows a bullish crossover with the MACD line (blue) crossing above the signal line (grey). Both lines are below the zero baseline, and the histogram (green bars) is positive. This suggests that while the overall trend is down, short-term bearish momentum is fading, and buyers are attempting to step in.
Conclusion: The chart is in a bearish short-term trend. However, the RSI and MACD indicate the potential for a temporary pause in selling pressure or a minor correction back towards S1/R1. A confirmed break below S1 would target S2, while a move above R1 would signal a potential trend reversal.
Disclaimer: This analysis is strictly for educational and informational purposes and does not constitute financial advice. Trading involves risk.*