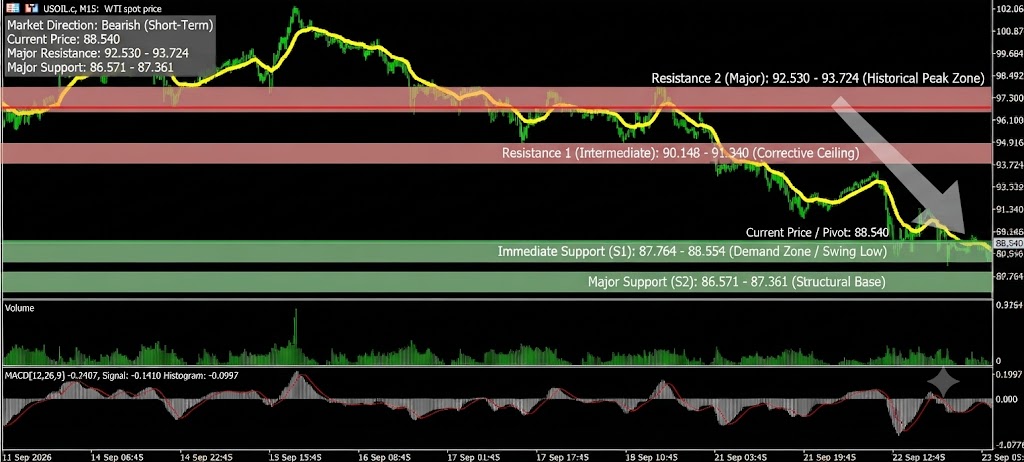



Based on the technical analysis chart for USOIL.c, M15 (WTI spot price) on September 23, 2026, here is the breakdown of the market direction, support, and resistance levels:
Market Direction
- Short-Term: Bearish. The price action is in a clear short-term downtrend, making a sequence of lower highs and lower lows. The price is currently at 88.540, having recently broken below previous support levels. The candles are predominantly red, indicating strong selling pressure.
- Medium-to-Long Term: Neutral-to-Bearish. While the immediate momentum is down, the broader context (not fully visible in this timeframe) would need to be assessed. However, the steepness of the recent decline suggests a significant bearish shift in the immediate future.
Support & Resistance Levels
Based on the recent price action and established zones:
| Level Type | Price / Zone | Description & Significance |
| Resistance 2 (Major) | ~92.530 – 93.724 | A major historical peak zone and significant psychological barrier. |
| Resistance 1 (Intermediate) | ~90.148 – 91.340 | The most recent lower-high corrective ceiling and area of previous price interaction. |
| Current Price / Pivot | 88.540 | The immediate market equilibrium point. The price is hovering just above a significant round-number level. |
| Immediate Support (S1) | ~87.764 – 88.554 | A critical short-term demand zone and the major swing low established in the most recent session. This is the immediate floor for the current downtrend. A break below this could accelerate the decline. |
| Major Support (S2) | ~86.571 – 87.361 | A deeper structural base and long-term historical support level. A drop below this would signal a significant acceleration of the bearish trend. |
Indicator Analysis
1. Price Action (Candlesticks & Moving Average)
- Observation: The candles show powerful, impulsive bearish momentum, with mostly red bars dominating the recent decline. The price has crossed and is now trading well below the yellow moving average line, which is acting as dynamic resistance. As long as the price is below this moving average, the path of least resistance is down.
- Interpretation: This confirms the short-term bearish bias. Buyers are weak, and every attempt to rally is being met with selling pressure. The moving average is a key level to watch; as long as the price is below it, the bias remains firmly to the downside.
2. MACD Sub-Panel (Moving Average Convergence Divergence)
- Observation:
- MACD Line (Blue): Currently well below the zero baseline and in a steep, sustained decline.
- Signal Line (Grey): Also declining and has been crossed below by the MACD line, confirming a bearish crossover signal. The current reading is -0.2407.
- Histogram (Green/Red Bars): Currently in the red and expanding downward, reflecting accelerating negative momentum. The current histogram reading is -0.1410.
- Interpretation: The MACD is providing a strong, sustained bearish signal. Both lines are below zero, and the histogram is expanding. This confirms the strength of the current downtrend and suggests that the price is likely to continue drifting lower in the immediate future. There are no signs of a bullish divergence or momentum reversal at this time.
Conclusion: The overall picture for USOIL.c on the M15 timeframe is bearish. The price action, moving average, and MACD all point to strong, accelerating selling pressure. The key to the next major move will be whether the price can hold the immediate support zone around S1. A failure to hold S1 would likely lead to a deeper correction toward S2. Conversely, a confirmed break above the immediate moving average and R1 resistance would signal a potential trend reversal or at least a significant relief rally.
Contact: +919063295953/4 | Website: www.mcxtips.in