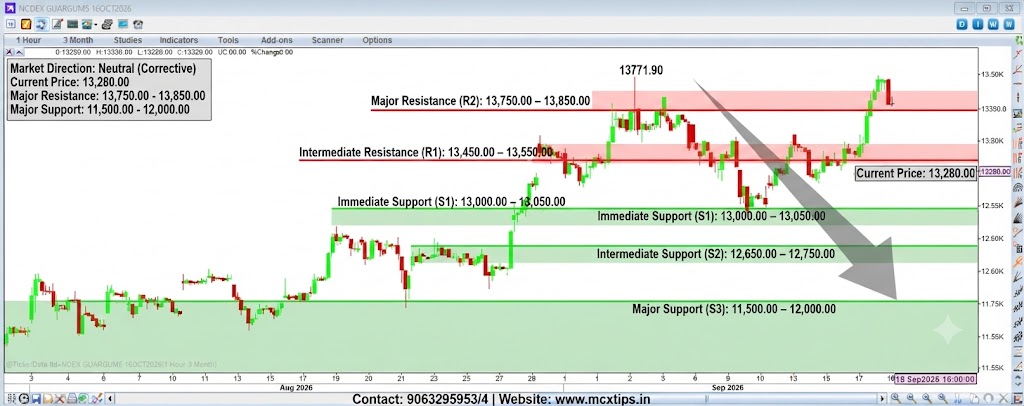



Based on the technical analysis chart for NCDEX GUARGUM5 16OCT2026 (1-Hour timeframe, 3-Month view), here is a detailed breakdown of market direction and support/resistance levels.
Market Direction
Medium-to-Long Term: Bullish. The broader 3-month structure shows a sustained macro uptrend, recovering from lower levels in early August and making higher highs and higher lows up toward the recent peak near 13,771K.
Short Term: Neutral to Corrective / Consolidative. Following the rejection near the highs, the price action has experienced a sharp pullback, currently trading near 13,280.00 as it attempts to find stabilization.
Support & Resistance Analysis
Level TypePrice / ZoneDescription & Technical SignificanceMajor Resistance (R2)13,750.00 – 13,850.00Major multi-week contract peak and heavy supply ceiling.Intermediate Resistance (R1)13,450.00 – 13,550.00Immediate overhead barrier representing recent minor swing highs.Current Price / Pivot13,280.00The immediate market equilibrium point during the correction.Immediate Support (S1)13,000.00 – 13,050.00Critical short-term demand floor protecting against deeper downside.Intermediate Support (S2)12,650.00 – 12,750.00Key horizontal support zone established during prior consolidation phases.Major Support (S3)11,500.00 – 12,000.00Long-term macro structural baseline and primary trend floor.
Disclaimer: This analysis is for informational purposes only and does not constitute financial advice.