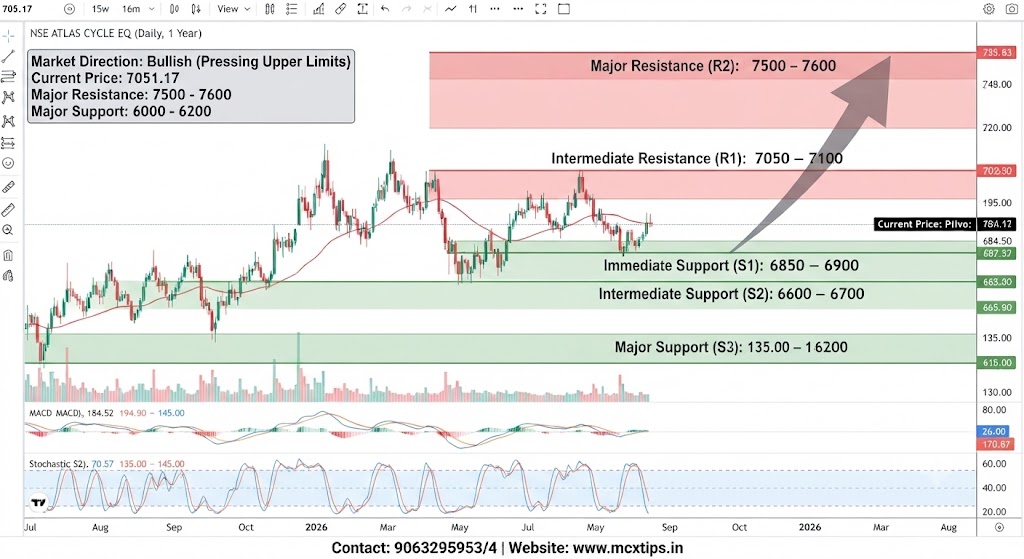



NCDEX GUARSEED10 16OCT2026 (Daily, 3-Month view), here is a detailed breakdown of market direction, support and resistance levels, and an analysis of the visible price structure.
Market Direction
- Medium-to-Long Term: Bullish. The broader 3-month chart structure demonstrates a clear, sustained upward trajectory. After establishing a foundational base and multiple consolidation zones near the 6000 – 6100K level, the price has formed a series of higher highs and higher lows, culminating in the recent strong impulsive rally.
- Short Term: Bullish and Pressing Upper Limits. The price action shows powerful buying momentum, recently printing consecutive large green candles to trade near its contract highs around 7051.17. While the trend is up, this type of near-vertical move is often technically overextended and may precede a period of consolidation or a mild pullback to allow indicators to cool.
Support & Resistance Analysis
| Level Type | Price Range / Zone | Description & Technical Significance |
|---|---|---|
| Major Resistance (R2) | ~7,500 – 7,600 | A significant psychological round number and potential next major target above the current highs, based on historical or psychological significance. |
| Intermediate Resistance (R1) | ~7,050 – 7,100 | The immediate, all-time or multi-week high being tested in the most recent session. A decisive break above this level would signal the continuation of the parabolic move. |
| Current Price / Pivot | 7,051.17 | The immediate market equilibrium point where price is consolidating after its recent explosive rise. |
| Immediate Support (S1) | ~6,850 – 6,900 | The top of the previous consolidation range and a level that acted as resistance before the latest breakout. |
| Intermediate Support (S2) | ~6,600 – 6,700 | A strong historical support zone, corresponding to multiple prior hourly and daily swing lows and a key pivot base. |
| Major Support (S3) | ~6,000 – 6,200 | The major long-term structural baseline and primary floor of the entire 3-month trading range, tested and held multiple times. |
Price Action Analysis
- Observation: The chart displays a classic bullish sequence. After a volatile sideways period in mid-August, buyers took firm control, creating an impulsive leg up (late August), followed by an orderly consolidation (early September), which has now resolved into a strong, near-vertical breakout to the current price of 7051.17.
- Interpretation: This confirms absolute dominance by the buyers in the short-to-medium term. The recent impulsive candles show high conviction, with the price closing near its highs. However, the lack of any significant pullback in this final leg suggests the market may be technically “overbought,” increasing the probability of a temporary “return to the mean” (pullback) or a sideways drift to digest these gains before any further ascent toward