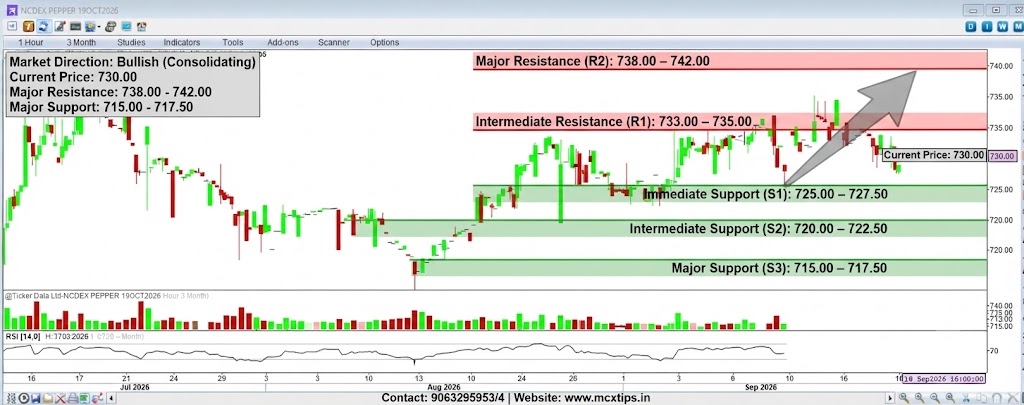



NCDEX PEPPER 19OCT2026 (1-Hour timeframe, 3-Month view), here is a detailed breakdown of the market direction, support and resistance levels, and an analysis of the visible price structure.
Market Direction
- Medium-to-Long Term: Bullish. The broader 3-month chart structure demonstrates a recovery phase following the strong structural low formed in August 2026, characterized by progressive higher lows and intermediate recovery peaks.
- Short Term: Consolidative to Mildly Bearish. The recent price action exhibits a corrective pullback from its upper range near the 737.00–738.00 zone, currently hovering around 730.00 as buyers and sellers test near-term equilibrium.
Support & Resistance Analysis
| Level Type | Price Range / Zone | Description & Technical Significance |
| Major Resistance (R2) | 738.00 – 742.00 | Major multi-week peak zone and upper supply boundary. |
| Intermediate Resistance (R1) | 733.00 – 735.00 | Recent swing high barrier and minor distribution ceiling. |
| Current Price / Pivot | 730.00 | The immediate market equilibrium point. |
| Immediate Support (S1) | 725.00 – 727.50 | Confluence of recent hourly consolidation floors and short-term demand clusters. |
| Intermediate Support (S2) | 720.00 – 722.50 | Previous pivotal reaction zone protecting the broader upward trend. |
| Major Support (S3) | 715.00 – 717.50 | Major multi-month swing low established during the August correction base. |
Price Action Analysis
- Observation: The chart displays an impulsive upward recovery following the sharp spike low in mid-August 2026, which has since transitioned into a choppy, range-bound consolidation phase near the upper boundaries.
- Interpretation: The lack of aggressive continuation past the recent highs indicates short-term exhaustion or profit-taking, though the higher-low structure from August remains structurally intact.