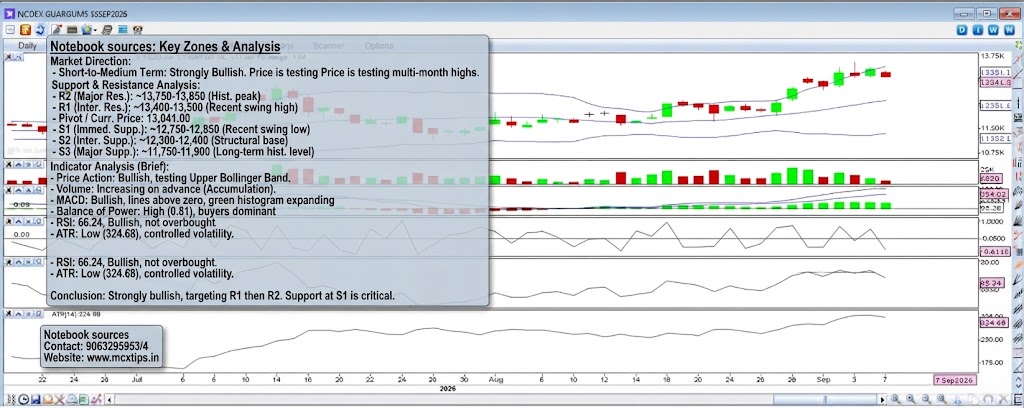



NCDEX GUARGUM5 (18SEP2026) chart, including support/resistance levels and an analysis of every visible indicator.
Market Direction
- Short-to-Medium Term: Strongly Bullish. Following a period of consolidation in July and early August 2026, the price action has established a clear, sustained upward trajectory, characterized by a series of higher highs and higher lows. The price is currently challenging multi-month highs.
Support & Resistance Analysis
| Level Type | Price / Zone (K) | Description & Significance |
| Major Resistance (R2) | ~13,750 – 13,850 | A significant psychological and historical supply zone, corresponding to a major peak from early 2026. |
| Intermediate Resistance (R1) | ~13,400 – 13,500 | The immediate overhead barrier, aligning with the very recent swing high. A decisive break above this could lead to R2. |
| Current Price / Pivot | 13,041.00 | The immediate market equilibrium point. While elevated, it is currently consolidating just below recent highs. |
| Immediate Support (S1) | ~12,750 – 12,850 | The most recent minor swing low and a key area where previous rallies found buying interest. This also aligns with the central Bollinger Band®. |
| Intermediate Support (S2) | ~12,300 – 12,400 | A key structural base established during the late-July/early-August rally. This is a significant “demand zone.” |
| Major Support (S3) | ~11,750 – 11,900 | A long-term historical support level, tested multiple times throughout the 1-year period. A break below this would signal a major trend reversal. |
Indicator Analysis
1. Price Action (Candlesticks & Bollinger Bands®)
- Observation: The candles show a series of strong, impulsive green bars during the current uptrend. The price has moved from the lower Bollinger Band®, crossed above the moving average (middle band), and is now testing the upper Bollinger Band®. The bands themselves are starting to widen, indicating increasing volatility as the price rises.
- Interpretation: This is a classic bullish setup. The price action reflects strong, persistent buying pressure, and the move towards the upper band suggests the uptrend is intact and has not yet become technically overstretched in the short term.
2. Volume Sub-panel (Green/Red Bars)
- Observation: Volume has been relatively erratic but shows a positive trend. There were significant spikes during the major rally phases in mid-2026 (not visible on the 1-year view but implied by the large price candle) and again during the most recent breakout to new highs. The recent accumulation bars are prominent.
- Interpretation: The recent increase in volume during the price advance validates the bullish move. It confirms that there is real conviction and accumulation behind the uptrend, suggesting the move is sustainable.
3. MACD Sub-panel (Moving Average Convergence Divergence)
- Observation: The MACD line (blue) crossed above the Signal line (grey) in mid-August, signaling the start of the current bullish phase. Both lines are now comfortably above the zero baseline. The Histogram (green bars) is positive and has recently expanded higher, with a current reading of 95.38.
- Interpretation: This is a very strong, sustained bullish signal. It indicates that positive momentum is accelerating and that the uptrend has not yet run its course. The widening histogram confirms increasing momentum.
4. Balance of Power Sub-panel
- Observation: This indicator has a strong positive bias and is currently high at 0.81. It has been oscillating, but almost entirely in the positive zone during the current rally phase.
- Interpretation: A reading of 0.81 is quite high, indicating that buyers are in firm control of the price action on a day-to-day basis and have been consistently aggressive.
5. RSI Sub-panel (Relative Strength Index [14,0])
- Observation: The RSI is at 66.24, which is squarely in the bullish zone (above 50) but not yet technically overbought (below 70).
- Interpretation: This confirms the health of the current uptrend. It suggests there is still room for the price to rise before the market becomes technically overextended, indicating that the bullish move can continue.
6. ATR Sub-panel (Average True Range [14])
- Observation: The Average True Range is currently low at 324.68, especially relative to the massive volatility spike seen in late 2025. The ATR has been trending slightly lower during the current rally.
- Interpretation: A low ATR value indicates a relatively low volatility environment. This is common during steady, sustainable uptrends. It suggests that while the price is moving higher, the daily fluctuations are not excessive, which can be a sign of a controlled and healthy market.
Conclusion
The overall picture for NCDEX GUARGUM5 (18SEP2026) is strongly bullish. Every single technical indicator points to positive momentum, buyer control, and a sustainable uptrend from the current base. The price is approaching intermediate resistance at R1, and if it can break above this level, it is likely to make a run for the major historical resistance zone at R2. Support at S1 is now a critical floor for maintaining this bullish structure.