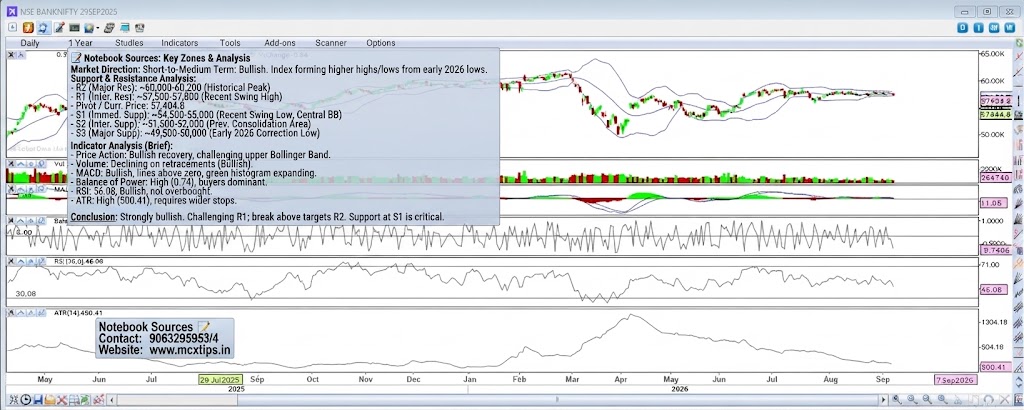
Based on the technical analysis chart for NSE BANKNIFTY (Daily, 2 Year), here is a detailed breakdown of support and resistance levels and an analysis of every visible indicator.
Market Direction
- Short-to-Medium Term: Bullish. Following the significant correction in early 2026 (where the price touched its lower Bollinger Band), the index has formed a clear sequence of higher highs and higher lows, establishing a new upward trajectory.
- Long-Term: Neutral-to-Bullish. While the longer-term trend shows historical peaks well above current levels, the recent price action indicates a strong recovery phase from the mid-term lows.
Support & Resistance Analysis
| Level Type | Price Range / Zone | Significance |
| Major Resistance (R2) | ~60,000 – 60,200 | Historical multi-year peak zone. A major psychological and technical barrier. |
| Intermediate Resistance (R1) | ~57,500 – 57,800 | The most recent swing high and current trading range top. |
| Current Price / Pivot | 57,404.8 | The immediate market equilibrium point. |
| Immediate Support (S1) | ~54,500 – 55,000 | A key recent swing low and the top boundary of the previous consolidation phase. This level aligns with the central Bollinger Band®. |
| Intermediate Support (S2) | ~51,500 – 52,000 | A significant previous consolidation area and a strong historical pivot point. |
| Major Support (S3) | ~49,500 – 50,000 | The major low established during the early 2026 correction. A critical structural floor. |
Indicator Analysis
1. Price Action (Candlesticks & Bollinger Bands®)
- Observation: The candles show a strong, consistent recovery from the yearly lows. The price has moved from the lower band, crossed the central band, and is now challenging the upper third of the Bollinger Bands. The bands themselves are starting to narrow after the volatile period, indicating a potential easing of volatility as the price stabilizes.
- Interpretation: This confirms the bullish trend reversal. The price is now in an “accumulation” phase within the upper range, suggesting buying pressure remains dominant.
2. Volume (Sub-panel 1)
- Observation: Volume levels spiked dramatically during the major sell-off in early 2026 (signaling capitulation) and again during the subsequent rebound (signaling accumulation). Currently, volume is moderate and has been steadily declining during the latest small pullback phases.
- Interpretation: The decline in volume during retracements is a bullish sign. It indicates that sellers are not committing to a deep correction, and the broader uptrend remains intact without heavy distribution.
3. MACD [12,26,9] (Sub-panel 2)
- Observation: The MACD line (blue) crossed above the signal line (grey) during the early 2026 recovery and both lines remain comfortably above the zero baseline. The histogram (green bars) is currently positive and expanding upward, with a current reading of 35.15.
- Interpretation: This is a strong, sustained bullish signal. It confirms that positive momentum is accelerating and that the uptrend has not yet run its course.
4. Balance of Power (Sub-panel 3)
- Observation: This indicator has a strong positive bias and is currently high at 0.74. It has been oscillating with mostly positive readings during the current bullish phase.
- Interpretation: A reading of 0.74 is quite strong, indicating that buyers are in firm control of the price action and have been aggressively pushing the index higher on a day-to-day basis.
5. RSI [14] (Sub-panel 4)
- Observation: The Relative Strength Index is at 56.08, which places it firmly in the bullish zone (above 50) but not yet overbought (below 70).
- Interpretation: This confirms the health of the current uptrend. There is still significant room for the price to rise before the market becomes technically overstretched, suggesting the bullish move can continue.
6. ATR [14] (Sub-panel 5)
- Observation: The Average True Range is currently high at 500.41, although it has been trending lower from its peak during the early 2026 volatility spike.
- Interpretation: High absolute ATR readings indicate that the index is experiencing large average daily price swings. This confirms the volatile nature of the Bank Nifty, requiring traders to manage risk with wider stops.
Conclusion
The overall picture for NSE BANKNIFTY is strongly bullish. Every technical indicator points to positive momentum, buyer control, and a sustainable recovery trend from the early 2026 lows. The price is challenging intermediate resistance at R1, and if it can break above this level, it is likely to make a run for the major historical resistance zone at R2. Support at S1 is now a critical floor for maintaining this bullish structure.