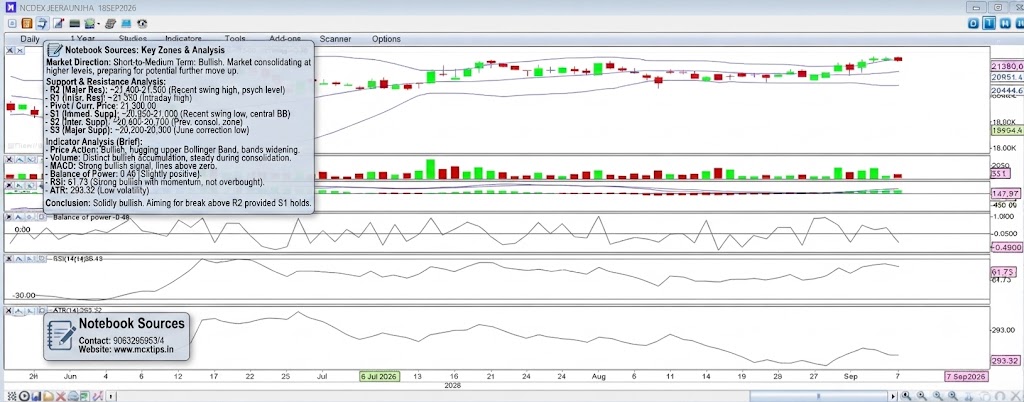
Here is a comprehensive technical analysis of the provided NCDEX JEERAUNJHA 18SEP2026 chart (Daily, 1 Year view).
Market Direction
- Short-Term: Bullish. The price action has formed a clear sequence of higher highs and higher lows following the correction in June 2026. The price is currently trading near multi-month highs, above the central Bollinger Band.
- Medium-Term: Strongly Bullish. The overall trend is up, establishing a series of rising peaks and troughs. The recent price action shows the market consolidating at these higher levels, preparing for a potential further move up.
- Long-Term: Bullish. As indicated by the 1-year view, the primary trend is up. The price is significantly higher than its lows from late 2025.
Support & Resistance Analysis
Based on the current price action and swing points, here are the key levels:
| Level Type | Price Point / Zone | Significance |
|---|---|---|
| Major Resistance (R2) | ~21,400 – 21,500 | A psychological round number and the recent swing high, marking the top of the current range. |
| Intermediate Resistance (R1) | ~21,350 | The very recent intraday high and the level currently being tested. |
| Current Price / Pivot | 21,300.00 | The immediate market equilibrium point. The market is consolidating around this level. |
| Immediate Support (S1) | ~20,950 – 21,000 | The most recent swing low. This is the primary level that must hold to keep the immediate bullish structure intact. It also aligns with the central Bollinger Band. |
| Intermediate Support (S2) | ~20,600 – 20,700 | A previous consolidation zone and area of prior swing lows. |
| Major Support (S3) | ~20,200 – 20,300 | The major swing low established after the June correction. A break below this would signal a significant trend reversal. |
Indicator Analysis
1. Price Action (Candlesticks & Bollinger Bands®)
- Observation: The price action has been bullish, forming a series of strong green candles during the rally. The price is currently hugging the upper half of the Bollinger Bands and has moved above the central band. The bands themselves are starting to widen, signaling an increase in volatility after a period of compression.
- Interpretation: This confirms the bullish bias. The price is finding acceptance at higher levels, and the expansion of the bands suggests a strong trend is in progress or about to accelerate.
2. Volume Sub-panel (Green/Red Bars)
- Observation: Volume has been relatively erratic but shows distinct bullish accumulation. There were significant volume spikes during the major rally phases in early July and mid-August. The current volume is moderate and has been steadily accumulating during the recent consolidation phase.
- Interpretation: The volume supports the bullish trend. The heavy buying during the breakouts indicates institutional interest, and the relatively steady volume during the pause suggests a lack of significant selling pressure.
3. MACD [12,26,9] Sub-panel
- Observation: The MACD line (blue) is well above the Signal line (grey), and both are comfortably above the zero baseline. The Histogram (green bars) is positive but has recently flattened, with a current reading of 99.41.
- Interpretation: This is a strong, sustained bullish signal. The lines above zero indicate the primary trend is solidly up. The flat histogram suggests that while momentum is still positive, the immediate acceleration has paused, confirming the consolidation phase.
4. Balance of Power Sub-panel
- Observation: This indicator oscillates around the zero line. Its most recent reading is 0.49. It has been oscillating with a slight positive bias during the current bullish phase.
- Interpretation: A reading of 0.49 indicates a relatively balanced market with a slight edge to the buyers. It suggests no extreme overextension in either direction, implying the current move is measured and controlled.
5. RSI [14,0] Sub-panel
- Observation: The Relative Strength Index is at 61.73. This is squarely in the bullish zone (above 50) but not yet technically “overbought” (above 70).
- Interpretation: This confirms the health of the current uptrend. It suggests strong bullish momentum is present without being overstretched, leaving room for the price to continue to rise before the market becomes technically overextended.
6. ATR [14] Sub-panel
- Observation: The Average True Range is currently low at 293.32, especially compared to the significant volatility spike seen earlier in the year. It has been relatively stable during the current rally.
- Interpretation: A low ATR value indicates a relatively low volatility environment. This is common during steady, sustainable uptrends. It suggests that while the price is moving higher, the daily fluctuations are not excessive, which is often a sign of a controlled and healthy market.
Conclusion
The overall picture for NCDEX JEERAUNJHA is solidly bullish across all timeframes. The price action, MACD, RSI, and Volume all confirm a sustainable uptrend with strong buyer control. The price is currently consolidating just below major resistance (R2) and above immediate support (S1). The most likely scenario is a continuation of the uptrend, aiming for a break above R2, provided S1 holds. The key to the next move is a confirmed break either above R2 or below S1.