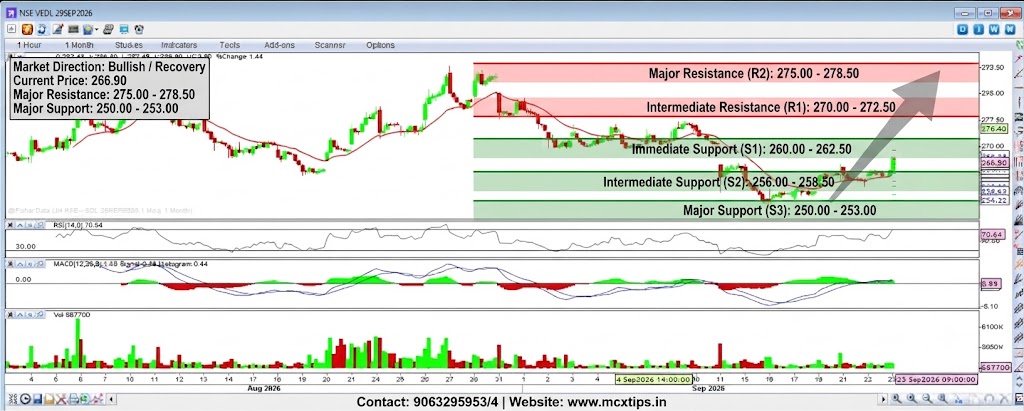
Based on the technical analysis of the provided NSE VEDL (29SEP2026) chart, here is the detailed breakdown of the market direction, key support and resistance zones, and indicator interpretations:
Market Direction
- Short-Term: Bullish / Recovery
- Market Status: After enduring a strong corrective pullback from higher swing levels, the stock has carved out a local base and is staging an upward recovery. Price action has crossed back above the short-term moving average line, showing a bullish shift in near-term momentum.
Support & Resistance Levels
| Level Type | Price Range / Point | Significance |
| Major Resistance (R2) | 275.00 – 278.50 | Heavy overhead supply and major ceiling zone matching previous swing highs. |
| Intermediate Resistance (R1) | 270.00 – 272.50 | Immediate overhead barrier and local breakout hurdle. |
| Current Price / Pivot | 266.90 | Active equilibrium point where price is consolidating recent gains. |
| Immediate Support (S1) | 260.00 – 262.50 | First short-term demand zone and dynamic moving average cushion. |
| Intermediate Support (S2) | 256.00 – 258.50 | Secondary technical support level aligned with prior reaction lows. |
| Major Support (S3) | 250.00 – 253.00 | Primary structural baseline from recent corrective troughs. |
Indicator Summary
- Price Action: Consecutive green candles pushing above the moving average line, signaling active buying interest near the 266.90 price handle.
- RSI (14): Hovering at 70.64, indicating strong short-term bullish momentum pressing into overbought territory.
- MACD: Displays a positive histogram value (0.44) with the MACD line crossing above the signal line, confirming increasing upward momentum.
Contact: +919063295953/4 | Website: www.mcxtips.in
Disclaimer: This analysis is strictly for informational and educational purposes and does not constitute financial advice.