





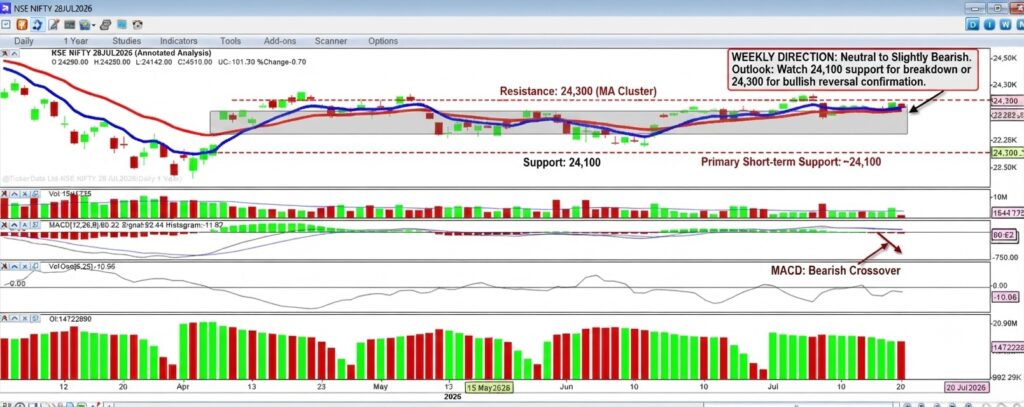
Trend Direction: Neutral to Slightly Bearish
- Price Action: The index has recently been in a consolidation phase, trading in a tight range between approximately 24,100 and 24,500. It has closed below both the shorter (red) and longer (blue) term moving averages, indicating a slight loss of short-term bullish momentum.
- Indicators:
- MACD: The MACD line (blue) has crossed below the signal line (red), and the histogram is negative. This is a bearish signal indicating downward momentum.
- Volume Oscillator: The oscillator is below the zero line, reflecting a decrease in buying participation.
Support and Resistance Levels for the Week
Based on the recent price action and chart structure:
| Level Type | Price Zone | Significance |
| Resistance | ~24,500 | This is the immediate psychological and technical hurdle. A strong, sustained move above this level is required to invalidate the current neutral-to-bearish outlook. |
| Resistance | ~24,300 | The level where the moving averages are currently clustered, providing immediate overhead supply. |
| Support | ~24,100 | This is the primary short-term support level. A break below this could lead to a further correction. |
| Major Support | ~23,800 – 23,900 | This zone represents a previous consolidation area and a stronger structural support level. |
Summary and Outlook
The chart shows the NIFTY is at a critical juncture. The recent breakdown below the moving averages and the bearish MACD crossover suggest that sellers have a slight edge. The immediate direction for the week depends on how the index reacts to these levels.
- Bearish Case: If the NIFTY breaks decisively below the 24,100 support, it will likely accelerate the downside toward 23,900 and 23,800.
- Bullish Case (Requires Confirmation): To turn the outlook positive, the index must first overcome the immediate resistance at 24,300 and then successfully challenge the 24,500 level.
For More details join our whats app grouphttps://chat.whatsapp.com/LQRjJ2JTfwd33NvQ6nAeEN
Disclaimer: I am an AI, not a financial advisor. Technical analysis is based on historical patterns and does not guarantee future results. Please conduct your own research or consult with a professional advisor before making any financial decision