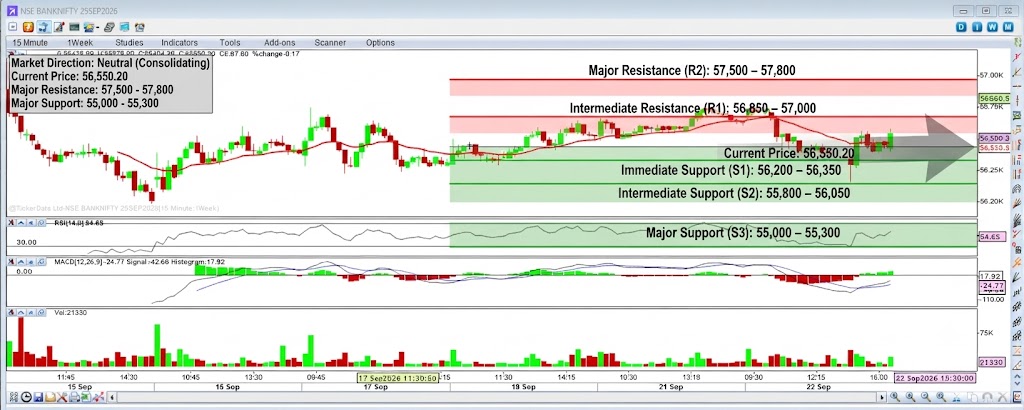
Based on the technical analysis of the provided NSE BANKNIFTY (29SEP2026) 15-minute timeframe chart, here is the breakdown of the market direction, key support and resistance zones, and indicator interpretations:
PNG
Market Direction
- Short-Term: Neutral / Consolidation with a Mild Upward Bias
- Market Status: After testing lower swing ranges, Bank Nifty has staged a recovery and is consolidating near the 56,550.20 level. The price action is currently hovering around the short-term moving average line, reflecting an equilibrium state as buyers and sellers contest near-term direction. PNG
Support & Resistance Levels
| Level Type | Price Zone / Point | Significance |
|---|---|---|
| Major Resistance (R2) | 57,500 – 57,800 | A significant upper ceiling corresponding to recent multi-session highs and major structural supply. |
| Intermediate Resistance (R1) | 56,850 – 57,000 | The immediate overhead barrier where prior recovery pushes encountered selling pressure. |
| Current Price / Pivot | 56,550.20 | The active market pivot point where price action is currently stabilizing. PNG |
| Immediate Support (S1) | 56,200 – 56,350 | The first short-term demand floor and dynamic moving average cushion protecting against intraday pullbacks. |
| Intermediate Support (S2) | 55,800 – 56,050 | A secondary technical support zone aligned with earlier local swing bases and consolidation troughs. |
| Major Support (S3) | 55,000 – 55,300 | The key structural baseline establishing the broader multi-session demand floor. |
Indicator Summary
- Price Action: Range-bound candles fluctuating closely around the moving average near 56,550.20, pointing to temporary intraday consolidation. PNG
- RSI (14): Sitting at 54.65, positioned just above the neutral 50 centerline, indicating a slight positive tilt in momentum without being overbought. PNG
- MACD: Displays a minor positive histogram reading (17.92) with convergence near the zero line, confirming a flat, range-bound short-term structure. PNG
Contact: +919063295953/4 | Website: www.mcxtips.in
Disclaimer: This analysis is strictly for informational and educational purposes and does not constitute financial advice.