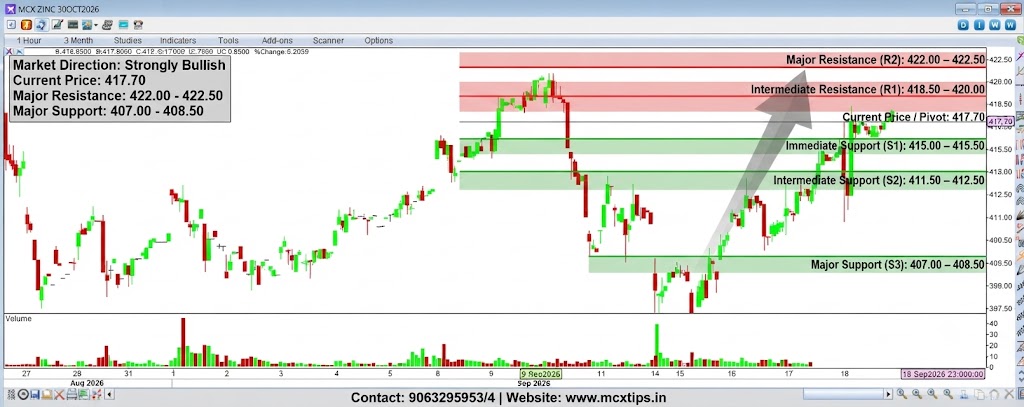
Based on the technical analysis chart for MCX ZINC 30OCT2026 on an 1 Hour timeframe, here is a breakdown of the market direction and support/resistance levels.
Market Direction
- Short-to-Medium Term: Strongly Bullish. Following a significant V-shaped recovery from mid-September lows near 397.50, the price action has established a clear, sustained upward trajectory. The market is carving out a series of higher highs and higher lows, culminating in the recent break above the 415.00 resistance zone. The current price of 417.70 is near multi-week highs, indicating strong upward momentum.
Support & Resistance Analysis
| Level Type | Price Range / Zone | Description & Technical Significance |
| Major Resistance (R2) | ~422.00 – 422.50 | Historical multi-month peak zone and significant psychological round number. This is the ultimate supply ceiling. |
| Intermediate Resistance (R1) | ~418.50 – 420.00 | The immediate overhead barrier, corresponding to the recent swing high reached on the latest rally attempt. |
| Current Price / Pivot | 417.70 | The immediate market equilibrium point. The price is currently consolidating near this level after the breakout. |
| Immediate Support (S1) | ~415.00 – 415.50 | A critical short-term structural floor. This zone acted as major resistance before the breakout and is now expected to provide support (polarity principle). It also aligns with recent consolidation. |
| Intermediate Support (S2) | ~411.50 – 412.50 | Previous consolidation area and a key inflection point established during the mid-September rally. |
| Major Support (S3) | ~407.00 – 408.50 | The major structural base and baseline floor from the early stages of the V-shaped recovery. A break below this would signal a major trend reversal. |
Price Action Interpretation
- Observation: After the sharp impulsive rally to the 417.70 area, the price action shows some minor volatility and profit-taking, with alternating small red and green candles. The price is holding firm above the S1 breakout level.
- Interpretation: This confirms that the immediate bullish momentum is dominant, and the market has entered a healthy “breakout and retest” phase. The ability of the price to stay above the former resistance (S1) is a very positive sign, suggesting buyers are stepping in on minor dips to defend the new higher range. The next major target is R1, followed by the all-time high at R2. A failure to hold S1 would lead to a deeper retracement toward S2.
Disclaimer: This analysis is for informational purposes only and does not constitute financial advice.