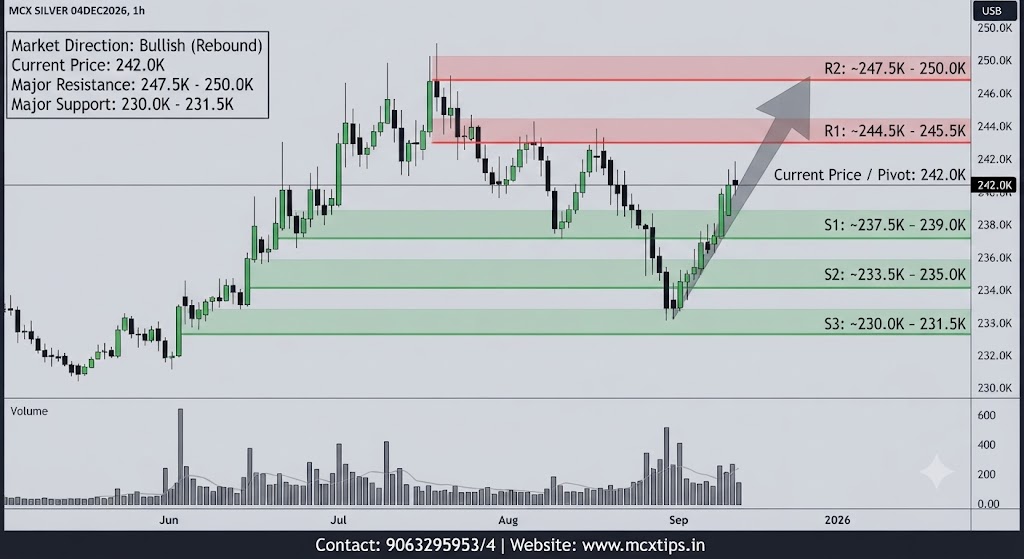
Based on the technical analysis chart for MCX SILVER 04DEC2026 (1-Hour timeframe, 3-Month lookback period), here is a professional-grade technical audit covering market direction, support and resistance levels, and price action interpretation.
Market Direction
- Medium-to-Long Term: Bullish. The broader 3-month structure reflects a primary upward trajectory, characterized by a series of higher highs and higher lows following a strong recovery from multi-month lows near the 230.0K region.
- Short Term: Bullish / Rebound. After experiencing a sharp correction down toward the mid-September lows, the price action has staged a swift and impulsive recovery, currently trading near the 242.0K equilibrium mark with strong upward momentum.
Support & Resistance Analysis
| Level Type | Price / Zone | Description & Technical Significance |
|---|---|---|
| Major Resistance (R2) | ~247.5K – 250.0K | The major multi-week peak zone and absolute contract supply ceiling from the late August highs. A decisive break above this area opens the path for macro continuation. |
| Intermediate Resistance (R1) | ~244.5K – 245.5K | The immediate overhead barrier corresponding to the recent swing high of the latest recovery wave. |
| Current Price / Pivot | 242.0K | The immediate market equilibrium point where the price is consolidating and digesting recent gains. |
| Immediate Support (S1) | ~237.5K – 239.0K | A critical short-term structural floor aligning with recent consolidation zones and swing lows. Holding this level is essential to keep the bullish bias intact. |
| Intermediate Support (S2) | ~233.5K – 235.0K | A strong historical pivot base and former resistance-turned-support established during the mid-September stabilization phase. |
| Major Support (S3) | ~230.0K – 231.5K | The major structural base and absolute baseline floor established during the early September capitulation low. A break below here would reverse the macro structure. |
Price Action Interpretation
- Observation: Following a sharp corrective sell-off earlier in the month, the price action formed a robust base and transitioned into an aggressive, impulse-driven recovery leg characterized by dominant green hourly candles pushing toward the 242.0K mark.
- Interpretation: Buyers have re-asserted control with strong momentum, absorbing selling pressure from the prior drop. The price is currently testing the upper boundaries of its recent local range. As long as prices hold above S1, the path of least resistance favors a test of R1.
Disclaimer: This analysis is for informational purposes only and does not constitute financial advice.