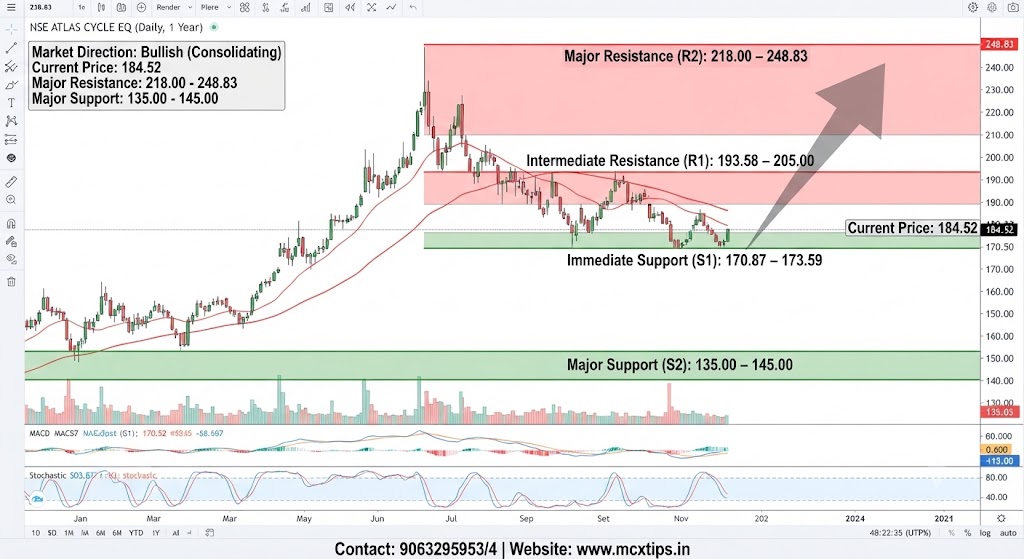
Based on the technical analysis chart for MCX LEAD 30SEP2026 (1-Hour timeframe, 3-Month view), here is a breakdown of the market direction and support/resistance levels.
Market Direction
- Medium-to-Long Term: Bullish. The chart shows a clear, sustained macro uptrend originating from the multi-month lows near 188.50 in late July 2026. This recovery formed a series of higher highs and higher lows, culminating in the recent peak around the 200.00 psychological level.
- Short Term: Neutral to Corrective. Following the rejection at the 200.00 highs, the price action has experienced a sharp, impulsive pullback, currently battling near the 197.50 equilibrium point. The recent candles are volatile with wicks on both sides, indicating a tug-of-war between buyers and sellers and a period of consolidation within the larger uptrend.
Support & Resistance Analysis
| Level Type | Price / Zone | Description & Technical Significance |
| Major Resistance (R2) | 200.00 – 200.50 | Major psychological round number and the primary multi-year historical supply ceiling. A break above here is needed to resume the macro uptrend. |
| Intermediate Resistance (R1) | 198.50 – 199.00 | The recent swing high of the latest rally attempt and the immediate overhead barrier. |
| Current Price / Pivot | 197.50 | The immediate market equilibrium point, where price is battling to find stability after the recent drop. |
| Immediate Support (S1) | 196.00 – 196.50 | A critical short-term structural floor, aligning with the top of the prior consolidation zone and recent swing lows. Holding above this is key to maintaining the bullish structure. |
| Intermediate Support (S2) | 195.00 – 195.50 | Previous major consolidation area and a strong historical pivot base established during the early September rally. |
| Major Support (S3) | 192.00 – 193.00 | A significant historical support zone and a key baseline floor from mid-August. A break below this would signal a major trend reversal. |
Price Action Interpretation
- Observation: Following the strong impulsive rally to the 200.00K area, the price action has become choppy and volatile, with the most recent move being a steep, impulsive drop characterized by a series of red candles. The price is now battling at the 197.50K level.
- Interpretation: This confirms that the immediate bullish momentum has stalled, and the market has entered a consolidation or correction phase. The heavy accumulation during the uptrend is a positive long-term sign, but the recent retracement indicates sellers have a strong short-term presence. The price is currently testing the upper bounds of its prior trading range. Buyers need to hold the price above S1 (196.00-196.50) to prevent a deeper retracement toward S2 (195.00-195.50).
Disclaimer: This analysis is for informational purposes only and does not constitute financial advice.