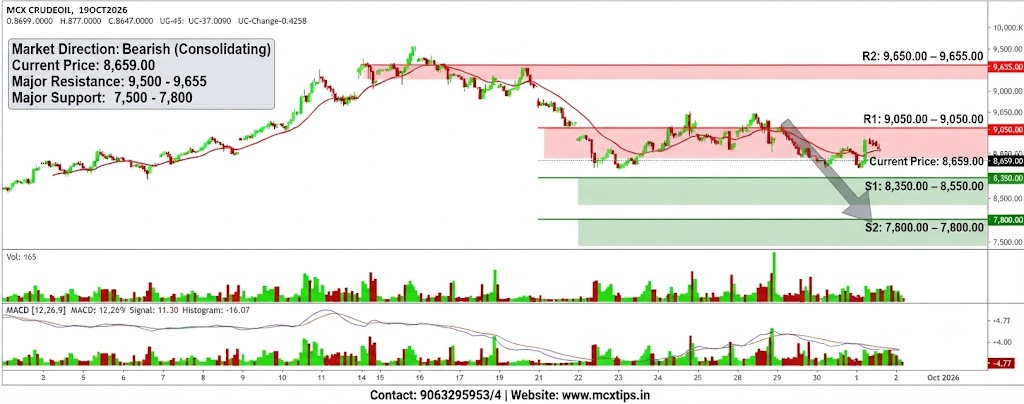



Based on the technical chart for MCX CRUDEOIL 19OCT2026, here is the detailed market direction and support/resistance breakdown:
Market Direction
- Short-to-Medium Term: Bearish (Consolidating)
- Analysis: Following a major pullback from earlier highs near the 10,000 mark, the market has established a sequence of lower highs and lower lows. Currently, the price is consolidating around the 8,659.00 level, indicating a short-term pause or equilibrium within the broader downtrend.
Support & Resistance Levels
| Level Type | Price Range / Zone | Description & Significance |
| Major Resistance (R2) | 9,500.00 – 9,655.00 | Historical peak zone and major psychological ceiling. |
| Intermediate Resistance (R1) | 9,000.00 – 9,050.00 | Immediate overhead barrier aligning with recent swing highs and the downward-sloping moving average. |
| Current Market Price / Pivot | 8,659.00 | Immediate equilibrium and consolidation level. |
| Immediate Support (S1) | 8,350.00 – 8,550.00 | Crucial demand zone / recent swing low floor. |
| Major Support (S2) | 7,500.00 – 7,800.00 | Structural base established during prior major pullbacks. |
Key Technical Indicators Overview
- Moving Average (Red Line): Continues to slope downwards above the current price action, serving as dynamic overhead resistance.
- MACD: Displays negative momentum values ($MACD: -4.77, Signal: 11.30, Histogram: -16.07$), indicating that sellers retain overall control despite the localized consolidation.
- RSI: Hovering around the 43.48 level, reflecting a neutral-to-bearish sentiment without being deeply oversold.