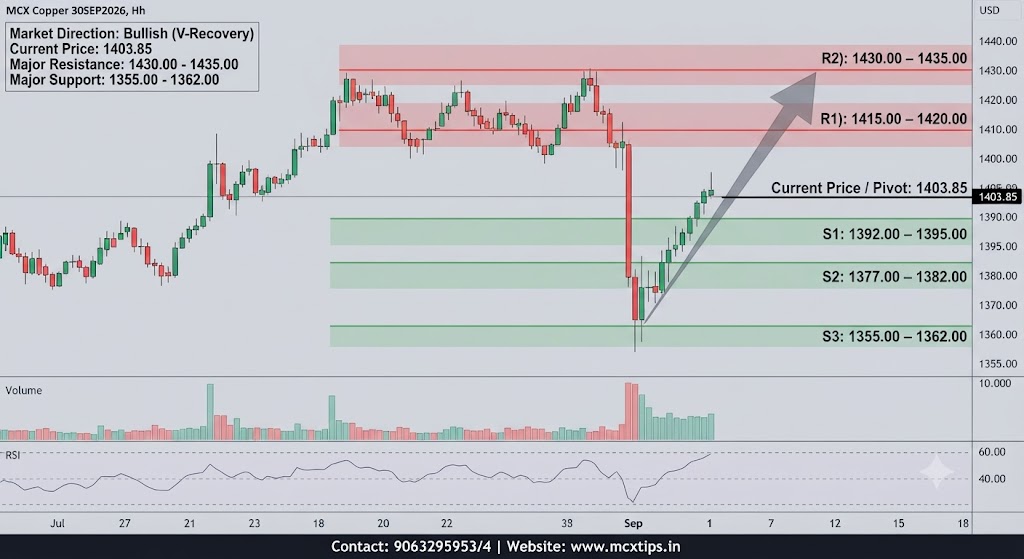
Based on the technical analysis chart for MCX COPPER 30SEP2026 (Daily, 3-Month view), here is a breakdown of market direction and support/resistance levels.
Market Direction
- Medium-to-Long Term: Bullish. The broader 3-month chart structure shows a clear macro uptrend, originating from lows near 136.0K in early 2025 and culminating in recent peaks near the 144.0K area.
- Short Term: Neutral to Consolidative. Following the rejection near the major 144.0K resistance, the price action has undergone a sharp, corrective pullback. The market is currently experiencing a period of consolidation and stabilization near the 140.3K level, characterized by alternating red and green candles, indicating indecision in the immediate term.
Support & Resistance Analysis
| Level Type | Price (K) / Zone | Description & Significance |
| Major Resistance (R2) | ~143.5K – 144.0K | The major multi-year contract peak and primary historical supply ceiling. A break above this would signal a continuation of the long-term uptrend. |
| Intermediate Resistance (R1) | ~142.0K – 142.5K | A minor, more recent swing high and immediate overhead barrier from the latest rally attempt. |
| Current Price / Pivot | 140.385 | The immediate market equilibrium point, where the asset is attempting to stabilize after the recent sell-off. |
| Immediate Support (S1) | ~139.0K – 139.5K | A critical short-term structural floor, corresponding to the recent swing low and top of the prior consolidation zone. Holding above this is essential to prevent a deeper correction. |
| Intermediate Support (S2) | ~137.5K – 138.2K | A strong historical horizontal support zone and key pivot base established in early August 2026. |
| Major Support (S3) | ~135.5K – 136.2K | The major structural base and long-term baseline support zone from the 2025–2026 macro cycle. A break below this would indicate a significant macro trend reversal. |
Price Action Analysis
- Observation: Following the rejection at the R2 zone, the price action has formed a distinct sequence of lower highs and lower lows, with the most recent decline characterized by an impulsive move down. The price is now testing stabilization levels near S1, with the last few hourly candles showing a battle between buyers and sellers.
- Interpretation: This confirms strong, aggressive selling pressure in the immediate term. The price is at a critical juncture where buyers need to step in to halt the correction; otherwise, a deeper move toward S2 is highly probable. The market is currently in a “correction” phase within a larger “bullish” trend.
Disclaimer: This analysis is for informational purposes only and does not constitute financial advice.