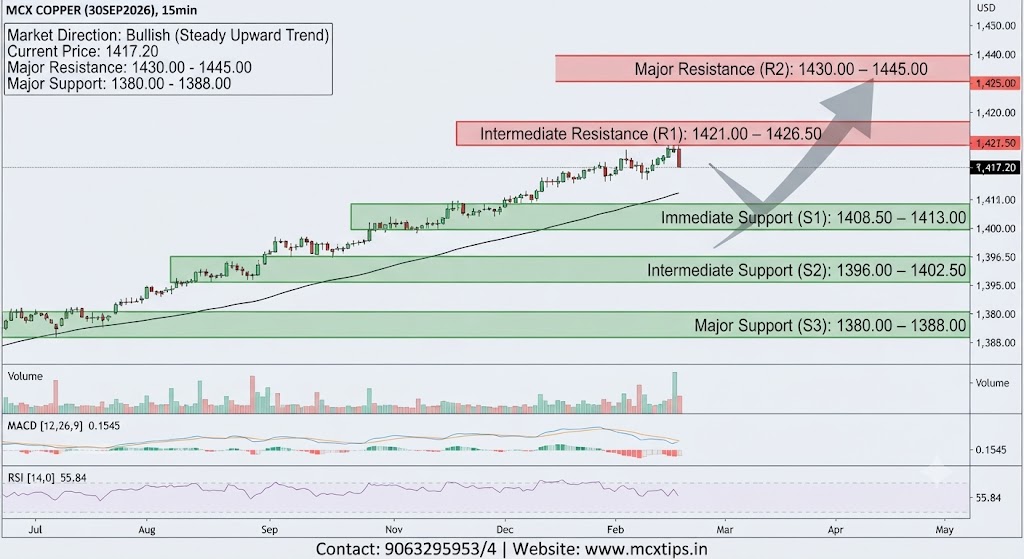
Based on the technical analysis of the provided MCX COPPER (30SEP2026) 15-minute timeframe chart, here is the breakdown of the market direction, key support and resistance zones, and indicator interpretations:
Market Direction
- Short-Term: Bullish / Steady Upward Trend
- Market Status: The price action demonstrates a consistent and orderly upward progression, trading cleanly above the rising moving average line and holding firm near the ₹1,417.20 level. The market maintains a solid bullish structure with higher highs and higher lows.
Support & Resistance Levels
| Level Type | Price Zone / Point | Significance |
| Major Resistance (R2) | ₹1,430.00 – ₹1,445.00 | The major session ceiling and upper psychological extension zone. A break above this region is required to accelerate the ongoing macro expansion. |
| Intermediate Resistance (R1) | ₹1,421.00 – ₹1,426.50 | The immediate overhead barrier corresponding to recent intraday swing peaks. |
| Current Price / Pivot | ₹1,417.20 | The active market equilibrium point where price action is currently consolidating. |
| Immediate Support (S1) | ₹1,408.50 – ₹1,413.00 | The first short-term demand floor and dynamic moving average buffer protecting against intraday pullbacks. |
| Intermediate Support (S2) | ₹1,396.00 – ₹1,402.50 | A stronger technical floor aligned with prior local consolidation bases. |
| Major Support (S3) | ₹1,380.00 – ₹1,388.00 | The deep structural baseline established prior to the latest bullish impulse leg. |
Indicator Summary
- Price Action: Steady green candles tracking closely along the upward-sloping moving average line, reflecting persistent buying pressure and structural resilience near ₹1,417.20.
- RSI (14): Hovering around 55.84, positioned comfortably above the neutral 50 line, signaling healthy upside momentum without entering overbought territory.
- MACD: The MACD line reads above the signal line with a positive histogram reading of 0.1545, verifying that short-term momentum favors buyers.
Contact: +919063295953/4 | Website: www.mcxtips.in
Disclaimer: This analysis is strictly for informational and educational purposes and does not constitute financial advice.