Date: July 10, 2026
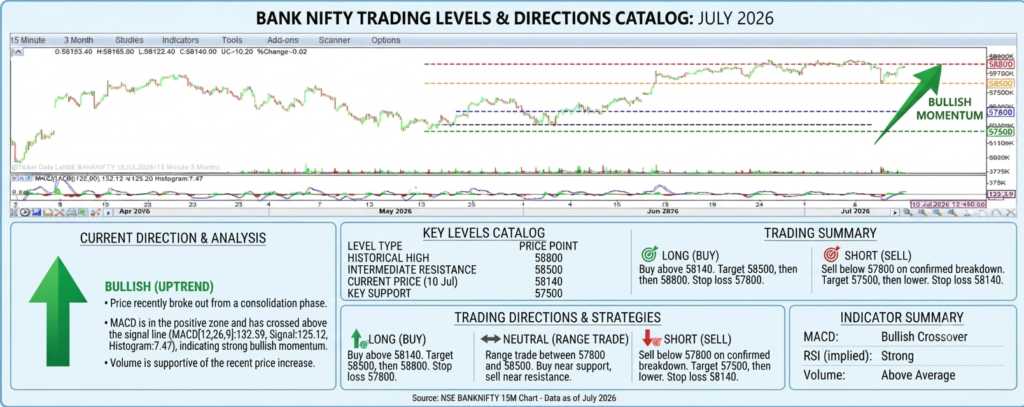
Market Overview The Bank Nifty index has demonstrated significant strength in the trading session of July 10, 2026, closing at 58140.0. This marks a decisive breakout from a recent consolidation phase, signaling a renewed bullish trend across the banking sector. The 15-minute chart for the period from April to July 2026 clearly illustrates this upward trajectory, with the index forming a series of higher highs and higher lows.
Technical Analysis & Key Levels
The current price action is strongly supported by both price and indicator analysis. The index has successfully breached immediate resistance levels, setting its sights on higher historical targets.
- Current Direction (Bullish): The primary trend is unequivocally bullish. The breakout above the 57800 level has invalidated the previous range-bound market structure, unleashing significant buying pressure.
- Support & Resistance Levels:
- Key Resistance: The immediate next target for the Bank Nifty is the 58500 intermediate resistance. A clear break above this level could see the index testing its historical high of 58800 in the near term.
- Key Support: The 57800 level, which previously acted as resistance, is now expected to provide strong immediate support. Further down, the 57500 level serves as a major support zone.
Indicator Confirmation
The bullish momentum is further validated by key technical indicators:
- MACD: The Moving Average Convergence Divergence (MACD) indicator is deep in the positive zone. Crucially, the MACD line (132.59) has crossed above the Signal line (125.12), and the positive histogram (7.47) is expanding. This classic bullish crossover is a strong signal that the uptrend has legs.
- Volume: The breakout has been accompanied by above-average volume, indicating strong institutional participation and conviction in the move. The volume on up-days has consistently outpaced the volume on down-days, confirming the accumulation.
Trading Strategies
Given the strong technical setup, traders can consider the following strategies:
- Long (Buy) Positions: Traders looking to enter the market can consider buying above the current price of 58140. The immediate target is 58500, followed by 58800. A stop-loss should be placed just below the immediate support at 57800 to manage risk.
- Neutral/Range Trade: For more conservative traders, the area between 57800 (support) and 58500 (resistance) can be utilized for range trading. Buy near support and sell near resistance until a clear directional bias emerges.
- Short (Sell) Positions: It is currently not advisable to take fresh short positions given the strong bullish momentum and indicator confirmations. Any short positions should only be considered on a confirmed breakdown below the major support at 57500, with a very strict stop-loss.
Conclusion
The Bank Nifty has entered a confirmed bullish phase as of July 10, 2026. The breakout, coupled with a bullish MACD crossover and supportive volume, suggests that the path of least resistance is upwards. While minor pullbacks can occur, the overall outlook remains positive, with traders favoring long positions towards the 58500 and 58800 targets.
Disclaimer: This article is for informational purposes only and does not constitute financial advice. All trading involves risk. Consult with a financial advisor before making investment decisions.