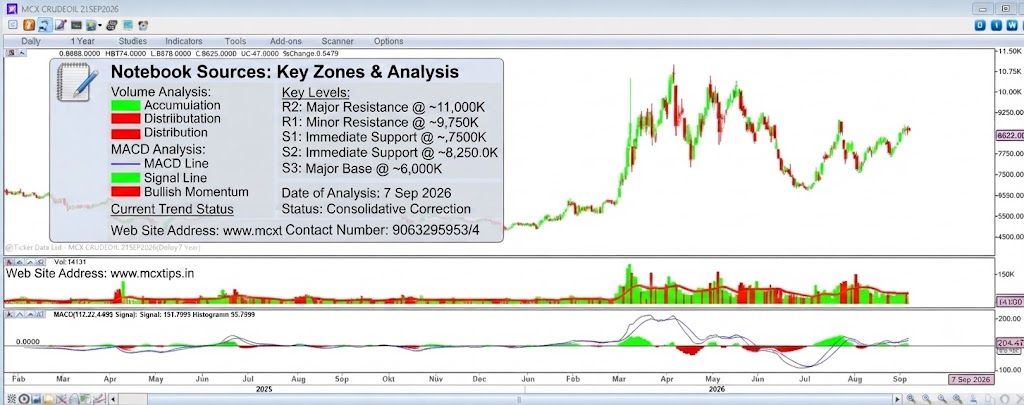
Here is a comprehensive technical analysis of the MCX CRUDEOIL chart.
Market Trend & Direction
- Medium-to-Long Term: Bullish. The chart shows a clear long-term uptrend originating from lows near 4750K in 2025, culminating in a significant rally to over 11.0K in mid-2026.
- Short Term: Neutral to Corrective. Following the major peak, the price has experienced a sharp pullback to around 8625K, indicating a period of consolidation or a healthy correction within the broader uptrend.
Support & Resistance Levels
| Level Type | Price (K) | Description & Significance |
| Resistance 2 (Major) | ~11,000K – 11,250K | All-time high and significant psychological and historical resistance zone. |
| Resistance 1 (Minor) | ~9,750K – 10,000K | Recent corrective lower high and intermediate barrier. |
| Pivot / Current Price | 8,625K | Immediate price point where the market is currently finding equilibrium after the recent drop. |
| Support 1 (Immediate) | ~8,250K – 8,500K | Short-term floor, aligning with recent swing lows and previous consolidation zones. |
| Support 2 (Intermediate) | ~7,000K – 7,250K | Previous major consolidation area and a significant level from early 2026. |
| Support 3 (Major Base) | ~6,000K – 6,250K | Key structural base established prior to the massive 2026 rally. |
Indicator Analysis
1. Price Action (Daily Candles)
- Observation: The chart exhibits a powerful, steep impulsive rally in early 2026, followed by a series of overlapping, volatile red and green candles at the highs and during the subsequent decline.
- Insight: The mix of candles at the peak suggests indecision and profit-taking. The current price action shows sellers are present, but the decline has been orderly rather than a freefall, suggesting it may be a retracement rather than a full trend reversal.
2. Volume Sub-Panel (Green/Red Bars)
- Observation: Volume spiked dramatically during the initial breakout and rally phase in early 2026, confirming strong institutional interest. Volume has generally subsided during the current pullback phase.
- Insight: The heavy accumulation during the uptrend is a bullish sign. Lower volume on the current retracement suggests a lack of significant selling pressure or panic liquidation, supporting the view that the primary trend remains intact.
3. MACD Sub-Panel (Moving Average Convergence Divergence)
- Observation:
- MACD Line (Blue): Peaked well above the zero line and is now in a steep decline.
- Signal Line (Grey): Also in a decline and has been crossed below by the MACD line (a bearish crossover signal).
- Histogram (Green/Red): Currently in the red and expanding downward, reflecting accelerating negative momentum. The current histogram value is 52.7599.
- Insight: The MACD confirms the short-term corrective phase and strong bearish momentum. It suggests that while the long-term trend is up, the price is likely to continue consolidating or drifting lower in the immediate future before a new bullish cycle can begin.