





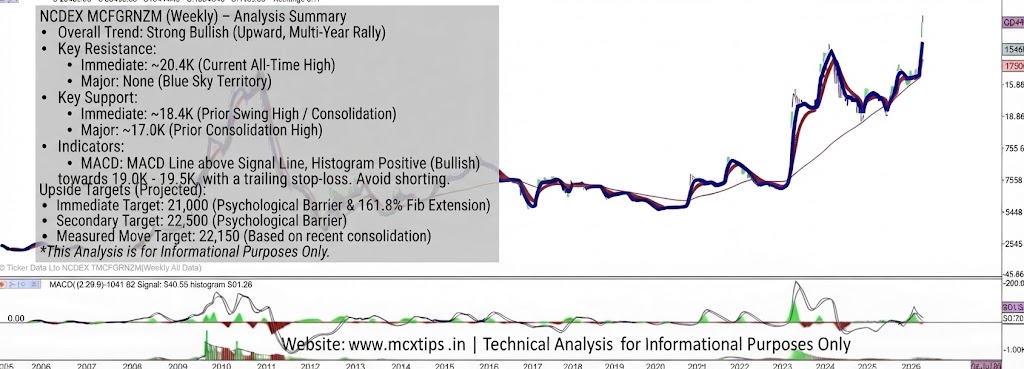
In this scenario, technical analysts use specific methods to project potential upside targets. Based on the chart provided, here are the most logical ways to determine potential targets:
1. Psychological Round Numbers
Traders often take profit or place sell orders at round, whole numbers, as these act as psychological barriers.
- First Target: 21,000
- Secondary Target: 22,500
- Tertiary Target: 25,000
These levels often see increased volatility as the market attempts to break through them.
2. Measured Moves (Chart Pattern Projection)
If we look at the most recent consolidation and breakout that led to the current all-time high, we can project the height of that pattern upwards to find a measured move target.
- The Setup: The price consolidated between roughly 18,385 (the prior resistance) and 16,500 (a lower base) before breaking out. This is a range of approximately 1,885 points.
- The Projection: Adding this range to the breakout point gives us a target.
- Calculation: 18,385+1,885=20,270
Note: Since the price is already above this measured move target (at 20406.85), this suggests the current move is very strong. A new, larger measured move would need to be calculated based on the entire rally from early 2026, which would be highly subjective.
3. Fibonacci Extensions (Using recent history)
While I previously stated extensions were not necessary, they can be used if a significant prior swing can be identified.
If we measure the major swing from the 2021 high down to the 2022 low and then up to the 2023 high (a complex “measured move” structure), we could derive targets. However, given the chart’s history, the simpler and more reliable method in “blue sky” territory is to use Fibonacci Projections from the last major rally (from the low near 14,000 up to the prior high near 18,385).
- The 161.8% Extension: A common target for a strong third wave or extended move.
- Calculation: (Rally of 4,385 points * 1.618) + 14,000 = ~21,095
Summary of Upside Targets
Combining these methods, the immediate potential upside targets for the NCDEX MCFGRNZM contract are:
- Immediate Target / Psychological Barrier: ~21,000 (Confluence with Fibonacci projection)
- Secondary Target / Psychological Barrier: ~22,500
Critical Advice for Trading All-Time Highs:
- Trailing Stop-Loss is Key: Instead of setting a fixed target and exiting, it is often more profitable to use a trailing stop-loss order to stay in the trend as long as it continues, only exiting when the price reverses by a certain amount.
- Watch for Reversal Signals: Be vigilant for any bearish reversal candlesticks (e.g., a weekly shooting star or bearish engulfing pattern) or a divergence on the MACD, which would signal that the momentum is fading.
- Targets are not Predictions: These targets are merely projections based on probability and market psychology. The market can stop well before, or go far beyond, these levels.
Disclaimer: This is a technical analysis for informational purposes only and does not constitute financial advice. Markets are volatile and can change direction quickly.
for more updates join our whatsapp group https://chat.whatsapp.com/Jrj3abV2S945BqYiQzOdk9