





Overall Trend Analysis (Direction)
The overall trend is Bullish (Upward).
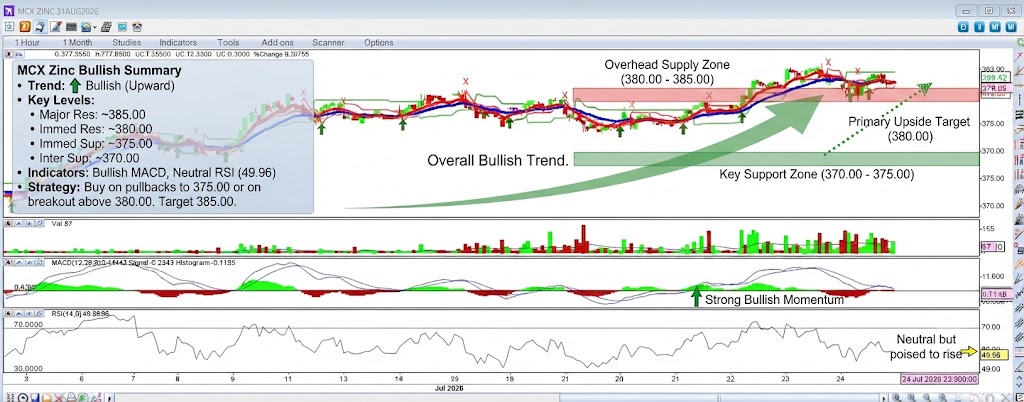
- Price Action: The price has established a clear series of higher highs and higher lows. It is currently trading above both the short-term red moving average and the medium-term blue moving average, which are also sloping upwards. The most recent price action shows a period of consolidation near the highs, which often precedes a further move up.
- Indicators:
- MACD: The MACD line is above the signal line, and the histogram is positive, indicating strong bullish momentum.
- RSI: The RSI is at 49.96, which is right at the neutral 50 level. This suggests that the upward momentum has paused for a moment, and the market is balanced. However, given the overall trend, this is likely a temporary breather rather than a reversal.
Conclusion: The direction is up. The current consolidation is a bullish continuation pattern. A break above the recent high would signal a continuation of the uptrend.
Support and Resistance Levels
These levels are derived from recent price action and key psychological points on the chart.
Resistance Levels (Upside Barriers)
- Immediate Resistance: ~380.00 This is the recent swing high and a major psychological level. The price has faced selling pressure here (visible as the red ‘X’ mark). A strong, high-volume break above this level is the primary bullish target.
- Major Resistance: ~385.00 Further up, this level marks a significant prior resistance from an older swing high. This would be the next target after a successful break of 380.00.
Support Levels (Downside Targets)
- Immediate Support: ~375.00 This is the most recent swing low and also aligns with the short-term red moving average. It is the first line of defense for the bulls.
- Intermediate Support: ~370.00 This level acted as resistance in the past and now should act as support. It also aligns with the longer-term blue moving average, making it a significant structural support zone.
- Major Support: ~365.00 This is a major psychological level and a longer-term structural support zone. A breakdown below this level would be required to signal a significant trend reversal.
Summary Strategy:
- The bias is bullish.
- Aggressive traders might look for buying opportunities on pullbacks to the immediate support level of ~375.00 with a stop-loss just below that level.
- Conservative traders should wait for a confirmed breakout and close above the ~380.00 resistance level before entering a long position, targeting ~385.00.
- The primary risk is a failure to hold the ~375.00 support, which could lead to a deeper correction towards ~370.00.
Disclaimer: This is a technical analysis for informational purposes only and does not constitute financial advice. Markets are volatile and can change direction quickly.