





Overall Trend Analysis (Direction)
The overall short-term trend is Neutral to Slightly Bearish.
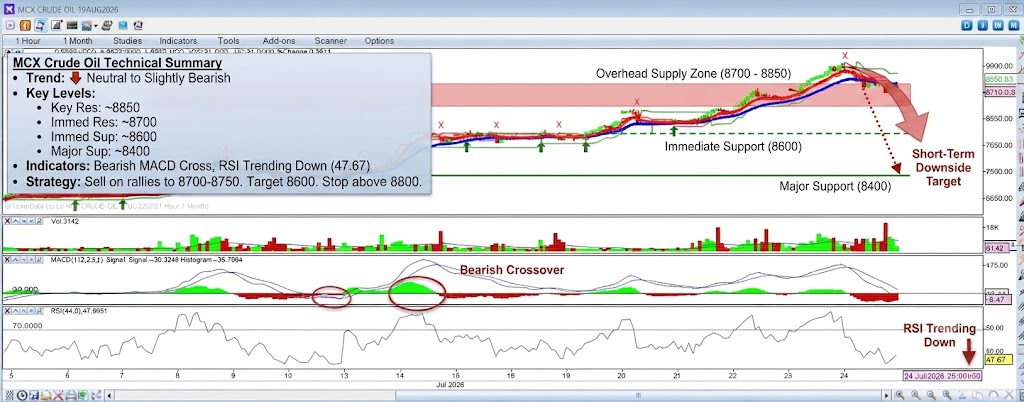
- Price Action: The price is in a corrective phase after hitting a recent high. It has formed a lower high (marked by the red ‘X’) and is now testing lower levels. The price is currently below both the short-term red moving average and the longer-term blue moving average, indicating a loss of upward momentum. The most recent candles show slight downward pressure.
- Indicators:
- MACD: The MACD line has crossed below the signal line, and the histogram is negative and increasing. This signals that bearish momentum is building.
- RSI: The RSI is at 47.67 and is trending downwards. It is below the 50 neutral level, suggesting that selling pressure is currently slightly greater than buying pressure.
Conclusion: The direction is down in the immediate short term. The market is pulling back after a strong rally.
Support and Resistance Levels
These levels are derived from recent price action and key psychological points on the chart.
Resistance Levels (Upside Barriers)
- Immediate Resistance: ~8700 (Current Price Area / Red MA) This is the immediate pivot point. To regain bullish momentum, the price must first close back above this level and the short-term red moving average.
- Key Resistance: ~8850 (Recent High / Major ‘X’ mark) This is the significant overhead supply zone where the price has repeatedly faced selling pressure. A convincing breakout above this level is required to resume the longer-term uptrend to new highs.
Support Levels (Downside Targets)
- Immediate Support: ~8600 This is the most recent swing low and the immediate downside target. A clear break below this level would signal a continuation of the downtrend.
- Major Support: ~8400 (Prior Consolidation Area) This is a key structural support zone where the price consolidated before its last leg up. It is also near the longer-term blue moving average, making it a significant area of interest for buyers.
- Deeper Support: ~8000 This is a major psychological level and a longer-term structural support zone.
Summary Strategy:
- The current bias is bearish in the short term.
- Short-term traders might look for selling opportunities on rallies that fail at the 8700 resistance zone, with a stop-loss just above that zone, targeting the 8600 and then 8400 support levels.
- Long-term investors should monitor the 8400 support level. A breakdown below this could signal a deeper correction. New long positions should not be considered until the price clears the 8850 resistance zone.
Disclaimer: This is a technical analysis for informational purposes only and does not constitute financial advice. Markets are volatile and can change direction quickly.