





Overall Trend Analysis (Direction)
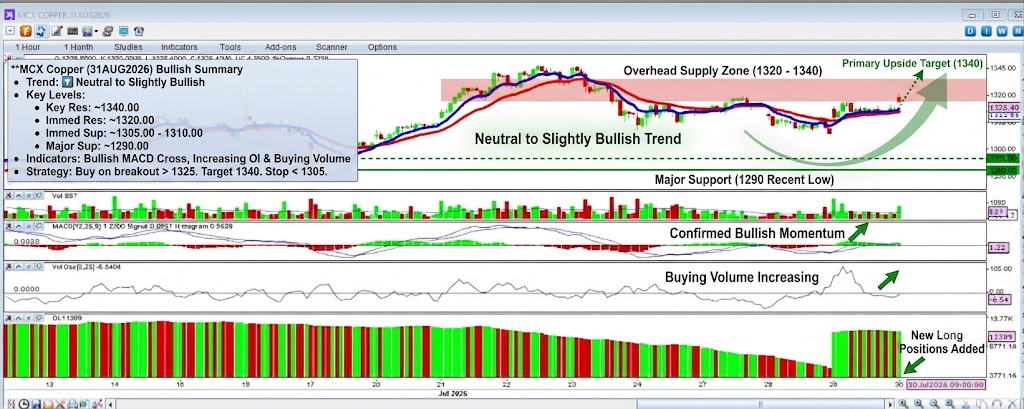
The overall short-term trend is Neutral to Slightly Bullish.
- Price Action: The price has recently recovered from a low near the 1290 level and is now consolidating in a narrow range, hovering just above both the short-term red moving average and the longer-term blue moving average. This indicates a pause in the selling pressure and a potential attempt to build a base for a further move up. The most recent candles are indecisive, reflecting a battle between bulls and bears.
- Indicators:
- MACD: The MACD line has crossed above the signal line, and the histogram is positive. This is a bullish signal, suggesting that momentum is shifting to the upside.
- Volume Oscillator: The oscillator is trending upwards towards the zero line, indicating that buying volume is starting to increase relative to selling volume.
- Volume Bars: The most recent volume bars are relatively balanced, with a mix of green (buying) and red (selling) bars, reflecting the current indecision.
- Open Interest (OI): The OI bars have spiked and are now predominantly green, suggesting that new long positions are being added, which is a bullish sign.
Conclusion: The bias is slightly to the upside due to the MACD crossover and increase in OI. However, the market needs to break out of its current consolidation range to confirm a new bullish trend.
Support and Resistance Levels
These levels have been derived from recent price action and key points on the chart.
Resistance Levels (Upside Barriers)
- Immediate Resistance: ~1320.00 (Psychological / Range Top) The price is currently struggling to move above the 1320-1325 area. This is the immediate hurdle for the bulls.
- Key Resistance: ~1340.00 (Prior Swing High) This marks the most recent significant swing high. A break above this level would be a strong confirmation of a resumed uptrend.
Support Levels (Downside Targets)
- Immediate Support: ~1305.00 – ~1310.00 (Moving Average Area) This zone, where the short-term and long-term moving averages are currently converging, is the first line of defense. As long as the price holds above this area, the bullish structure remains intact.
- Major Support: ~1290.00 (Recent Low) This level represents the most recent swing low and is a critical support level. A break below this would invalidate the immediate bullish bias and could lead to a deeper correction.
Summary Strategy:
- The current bias is bullish but cautious.
- Short-term traders might look for buying opportunities on a confirmed breakout above the ~1325.00 resistance level, with a stop-loss just below the ~1305.00 support zone, targeting the ~1340.00 swing high.
- More conservative traders may prefer to wait for a retest of the ~1310.00 moving average area as support before entering a long position.
- A breakdown below the ~1290.00 support zone would signal a change in the short-term trend and could lead to a retest of lower levels.
Disclaimer: This is a technical analysis for informational purposes only and does not constitute financial advice. Markets are volatile and can change direction quickly.