





Overall Trend Analysis (Direction)
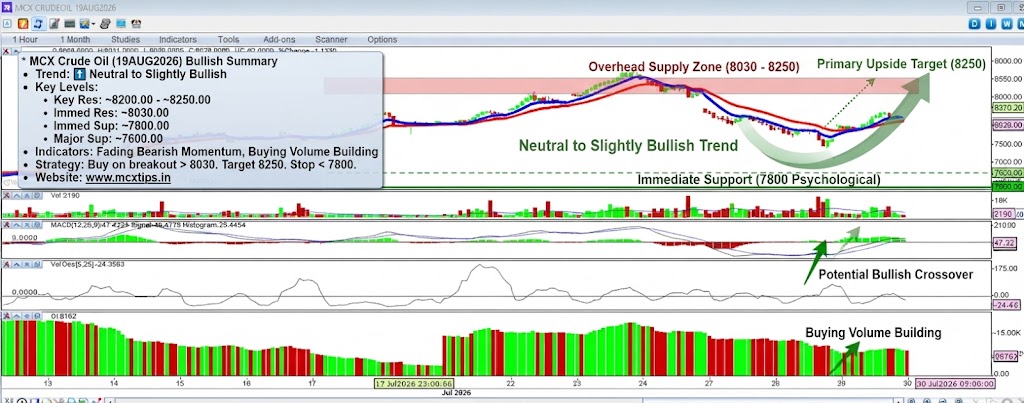
The overall short-term trend is Neutral to Slightly Bullish with a potential for consolidation.
- Price Action: The price has recently recovered from a low near the 7600 level and is now testing the area around the short-term red moving average and the longer-term blue moving average. The last few candles show a slight upward bias, but the price is currently consolidating just under the moving averages. A clean break above this moving average zone (~8030) is needed to confirm a stronger bullish move.
- Indicators:
- MACD: The MACD line is just below the signal line, but the histogram is very close to zero, suggesting a potential crossover to the bullish side. This indicates that bearish momentum is fading.
- Volume Oscillator: The oscillator is trending upwards towards the zero line, suggesting that buying volume is starting to increase relative to selling volume.
- Volume Bars: The recent volume bars are relatively balanced, with a mix of green (buying) and red (selling), reflecting the current indecision as the price approaches the moving averages.
- Open Interest (OI): The OI bars are trending downwards, which typically indicates short-covering or long-liquidation. In this context, combined with the price recovery, it suggests short positions are being closed.
Conclusion: The immediate bias is to the upside as the market attempts to reclaim the moving averages. The path of least resistance is slightly up, but significant resistance is just ahead.
Support and Resistance Levels
These levels have been derived from recent price action and key psychological points on the chart.
Resistance Levels (Upside Barriers)
- Immediate Resistance: ~8030.00 (Moving Average Zone) The price is currently consolidating right at the short-term red and long-term blue moving averages. This is the first major hurdle for the bulls. A confirmed break above this zone is necessary for further upside.
- Key Resistance: ~8200.00 – ~8250.00 (Prior High Zone) This zone marks the area of the most recent swing high. Sellers are likely to be active here, looking to defend the prior top.
- Major Resistance: ~8500.00 (Psychological Level) Further up, this major psychological round number is a significant overhead supply zone and a key long-term pivot point.
Support Levels (Downside Targets)
- Immediate Support: ~7800.00 (Psychological Level) This major psychological round number serves as the immediate downside target and the first line of defense against further selling.
- Major Support: ~7600.00 (Recent Low) This is the most recent swing low and the next significant downside target. A break below this level would invalidate the current recovery and signal a resumption of the downtrend.
- Deeper Support: ~7350.00 Below that, this level represents a deeper historical support zone.
Summary Strategy:
- The current bias is bullish in the short term, provided the price can sustain its momentum above the moving averages.
- Short-term traders might look for buying opportunities on a confirmed breakout above the ~8030.00 moving average zone, with a stop-loss just below that level, targeting the ~8200.00 and then ~8250.00 resistance levels.
- Alternatively, conservative traders may prefer to wait for a clearer break and retest of the ~8030.00 level as support before entering a long position.
- A failure to break above the moving averages and a subsequent breakdown below the ~7800.00 support zone would signal a change in the short-term trend to bearish, targeting the ~7600.00 level.
One Response
Finding a sports site that actually keeps things fair can be tough these days. I gave this platform a try for my weekend tennis sessions and the live tracking features are top notch. Deposit withdrawals went through without any weird delays and the odds stay consistent throughout the match. It is refreshing to play somewhere that respects your time. peparimatch