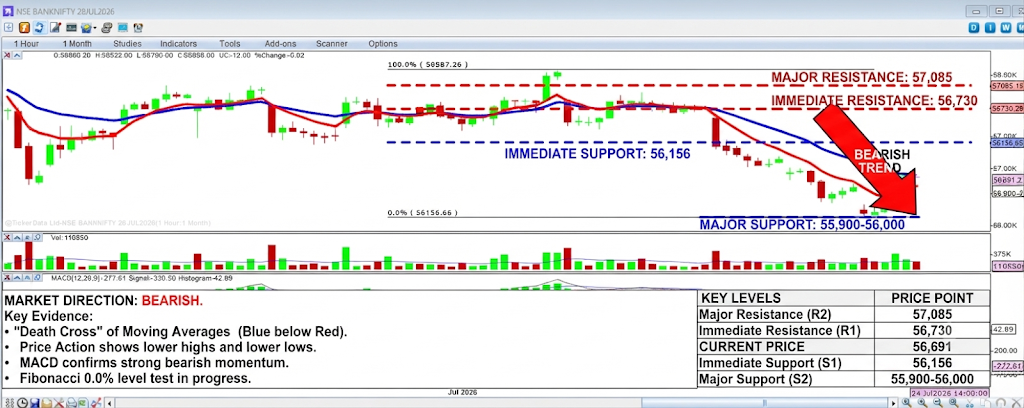
Market Direction: BEARISH (Short-Term)
The chart shows a clear short-term downtrend. The price has recently broken below the short-term moving average (blue line) and is currently consolidating below it after a significant drop. The most recent candles are showing indecision (small bodies, wicks), but the overall momentum is down.
Evidence:
- Price Action: The price has made a series of lower highs and lower lows on the hourly timeframe. The most recent large red candle confirms strong selling pressure.
- Moving Averages: The shorter-term (blue) moving average has crossed below the longer-term (red) moving average, which is a classic bearish signal (a “death cross” on this timeframe).
- Fibonacci Retracement: The price has dropped below the key 23.6% Fibonacci level (56730.28) and is testing the 0.0% level (56156.66). A sustained break below this would confirm further downside.
- Indicators (MACD): The MACD line is below the signal line and both are well below the zero line, indicating strong bearish momentum. The histogram is negative and showing signs of waning, suggesting the initial drop might be taking a pause.
Key Support and Resistance Levels
Based on the chart’s price structure and Fibonacci levels:
- Immediate Support (S1): 56156.66 (The 0.0% Fibonacci level). This is a critical level. A breakdown here opens the way for further losses.
- Major Support (S2): 55900 – 56000 (Psychological round number zone below the current low).
- Immediate Resistance (R1): 56730.28 (The 23.6% Fibonacci level and recent swing low).
- Key Resistance (R2): 57085.15 (The 38.2% Fibonacci level). This level also aligns with the intersection of the short-term (blue) moving average.
Disclaimer: This analysis is based on the provided chart snapshot and is for informational purposes only. It does not constitute financial advice. All trading involves risk.