





Overall Directional Bias
The overall trend is Strongly Bearish (Downward).
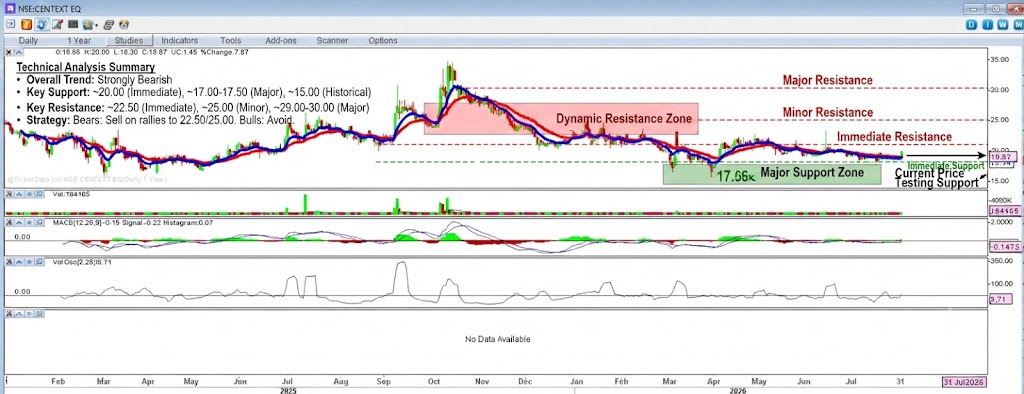
- Price Action: The stock is in a clear, multi-month downtrend. After establishing a multi-year high near 35.00 in late 2025, the price has experienced a significant and persistent decline, forming a series of lower highs and lower lows. It is currently testing the 20.00 psychological support level.
- Moving Averages: The short-term (red) and long-term (blue) moving averages are both sloping downwards and are fanned out, confirming the strength of the bearish trend. The price is trading well below both averages, which act as significant dynamic resistance.
- Indicators:
- MACD: The MACD line is below the signal line, and the histogram is negative, indicating strong and sustained bearish momentum. There is no sign of a bullish divergence or reversal.
- Volume Oscillator: The volume oscillator is low, suggesting that the recent price declines are not driven by high-conviction panic selling, but rather a slow, steady grind lower.
Conclusion on Direction: The market is firmly under the control of the bears. The path of least resistance is to the downside. Buying is strongly discouraged until a clear reversal pattern emerges.
Support Levels (Downside Targets)
These are key levels where buying interest could emerge, potentially halting a decline.
- Immediate Support: ~20.00 This is a critical psychological round-number level. The price is currently testing this area. A decisive break below this level would open the door for a further decline to the next major support zone.
- Major Support: ~17.00 – ~17.50 Farther down, this zone represents a significant historical low from 2025 before the major breakout. It is a major downside target for the current downtrend.
- Historical Support: ~15.00 Below that, this is a long-term historical floor and psychological level. A drop to this level would be a severe correction.
Resistance Levels (Upside Barriers)
These are key levels where selling pressure is likely to increase, potentially pausing or reversing an upward move.
- Immediate Resistance: ~22.50 This is the first minor resistance level, representing a recent minor swing high.
- Minor Resistance: ~25.00 This is a psychological level and a key area where the short-term (red) moving average is currently converging. A bounce to this level would be a selling opportunity for bears.
- Major Resistance: ~29.00 – ~30.00 This is a significant structural resistance level, representing the confluence of the long-term (blue) moving average and a prior price consolidation zone. A break above this level would be the first sign of a potential trend change.
Summary Strategy
- Bears: The bias is firmly negative. Traders can look for short positions on any minor rally to the ~22.50 or ~25.00 resistance zones, with a stop-loss just above the respective entry and an initial target of the ~20.00 support. A confirmed break of ~20.00 would allow for adding to short positions with a longer-term target of ~17.50.
- Bulls: Buying is strongly discouraged. The market is in a confirmed downtrend, and any long position is a high-risk counter-trend trade. Bulls should wait for a clear bullish reversal pattern, such as a double bottom or a break of the downtrend line, before considering any long entries.
Disclaimer: This technical analysis is for informational purposes only and does not constitute financial advice. Trading involves risk, including the loss of principal. Please conduct your own research or consult a professional financial advisor before making any trading decisions.
for more updates join our whatsapp group https://chat.whatsapp.com/Jrj3abV2S945BqYiQzOdk9