





Overall Directional Bias
The overall trend is Bullish (Upward).
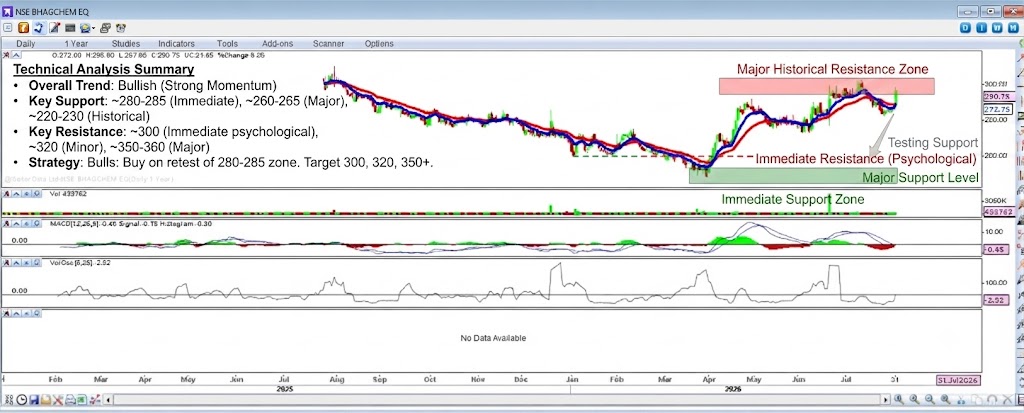
- Price Action: The stock has completed a significant multi-month correction and has recently formed a strong upward structure. It has created a series of higher highs and higher lows, culminating in a recent breakout. The price is currently trading at approximately 290.75, just off its recent highs.
- Moving Averages: The short-term (red) moving average is above the long-term (blue) moving average, confirming the bullish trend. Both averages are sloping upwards, and the price is trading above them, using the red average as dynamic support.
- Indicators:
- MACD: The MACD line is above the signal line, and the histogram is positive, indicating strong bullish momentum.
- Volume Oscillator: The volume oscillator shows spikes of increased volume on recent price advances, confirming strong buying interest and institutional participation.
Conclusion on Direction: The primary trend is up. The stock has strong momentum, and the bias is firmly positive. Any short-term pullback is likely to be a buying opportunity.
Support Levels (Downside Targets)
These are key levels where buying pressure is likely to emerge, potentially halting or reversing any decline.
- Immediate Support: ~280 – ~285 This zone represents the confluence of the short-term (red) moving average and the price level of a prior minor swing high. The price is currently testing this area, and a hold here would be a very bullish sign.
- Major Support: ~260 – ~265 This is a significant structural support level, representing the top of the recent breakout zone and the long-term (blue) moving average. A drop to this level would be a deeper correction but would offer a high-probability buying opportunity.
- Historical Support: ~220 – ~230 Farther down, this is the major historical accumulation and consolidation zone from the beginning of 2025. This represents the long-term floor for the current bullish phase.
Resistance Levels (Upside Barriers)
These are key levels where selling pressure is likely to increase, potentially pausing or reversing an upward move.
- Immediate Resistance: ~300 This is the first and most obvious psychological round number. It is also the level of the most recent swing high, creating a “double top” scenario in the immediate term.
- Minor Resistance: ~320 Higher up, this level has acted as both support and resistance in the past, creating a “memory” level where sellers may re-emerge.
- Major Resistance: ~350 – ~360 This is a significant historical resistance zone from the peak of the previous major uptrend in 2024. A decisive break above this level would signal the resumption of the larger multi-year bull market.
Summary Strategy
- Bullish Stance: Given the overall trend and momentum, traders may look to enter long positions on a successful retest and bounce from the ~280-285 support zone, with a tight stop-loss just below 280.
- Breakout Traders: Could wait for a confirmed daily close above the ~300 immediate resistance level to confirm the continuation of the uptrend, targeting 320 and then 350.
- Risk Caution: While the trend is bullish, the stock is extended. A failure to hold the ~280 support could lead to a deeper correction toward the ~260 major support.
Disclaimer: This technical analysis is for informational purposes only and does not constitute financial advice. Trading involves risk, including the loss of principal. Please conduct your own research or consult a professional financial advisor before making any trading decisions.
for more updates join our whatsapp group https://chat.whatsapp.com/Jrj3abV2S945BqYiQzOdk9