





Overall Directional Bias
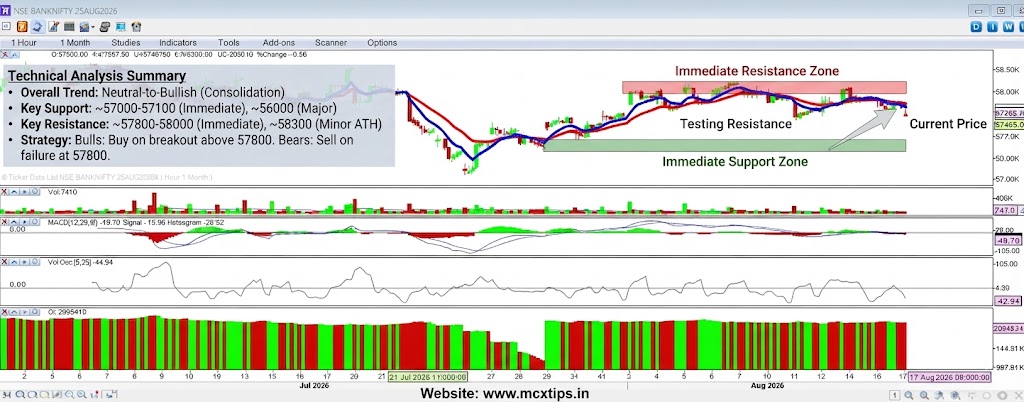
The overall short-to-medium term trend is Neutral-to-Bullish (Consolidation/Correction after a rally).
- Price Action: After a significant rally from the late July lows (near 52K) to the recent peak around 58K in early August, the market has entered a corrective phase. It has been trading in a defined range, making a series of lower highs and slightly lower lows, forming a potential bear flag or symmetrical triangle pattern. The price is currently trading at approximately 57465, just below its moving averages.
- Moving Averages: The short-term (red) moving average is just above the long-term (blue) moving average, but the price has recently dipped below both of them. This suggests a loss of immediate bullish momentum, but not yet a confirmed downtrend. Both averages are beginning to flatten, reinforcing the “neutral” consolidation view.
- Indicators:
- MACD: The MACD line is hovering just below the signal line, and the histogram is negative (red) but very small, indicating a lack of strong bearish conviction. It is currently coiling near the zero line.
- Volume Oscillator: The volume oscillator is showing very low volatility and declining volume, which is typical during a consolidation phase.
- Open Interest: Open interest is relatively flat, suggesting no massive new positions are being built on either side just yet.
Conclusion on Direction: The market is in a “wait-and-see” mode. It is correcting the previous overextended move. The bias is slightly defensive but could quickly turn bullish if the price breaks above the immediate resistance.
Support Levels (Downside Targets)
These are key levels where buying interest is likely to emerge.
- Immediate Support: ~57000 – ~57100 This is the first and most crucial short-term support level, representing the recent swing lows and the bottom of the current consolidation range. A decisive break below this level could trigger further selling toward the 56000-56500 area.
- Major Support: ~56000 A major psychological round-number level that also aligns with the bottom of a previous gap-up zone from early August. This is a critical structural support.
- Historical Support: ~55000 – ~55200 Farther down, this zone served as significant resistance before the big rally in early August. It should now act as strong support if tested.
Resistance Levels (Upside Barriers)
These are key levels where selling pressure is likely to increase.
- Immediate Resistance: ~57800 – ~58000 This zone is the first major hurdle. It encompasses the recent minor swing highs and the area where the short-term (red) moving average is currently converging. A break and hold above this level is required to negate the current bearish consolidation pattern and resume the uptrend.
- Minor Resistance: ~58300 This is the level of the recent all-time high. It will be a formidable psychological and historical barrier for the market to overcome.
- Projected Resistance: ~59000 Should the price break above 58300, this is the next significant psychological and Fibonacci extension target.
Summary Strategy
- Neutral/Cautious: The market is in consolidation. Traders may want to avoid entering large positions until a clear breakout occurs from the current ~57100 – ~57800 range.
- Bulls (Waiting for strength): Wait for a confirmed hourly close above the 57800 – 58000 resistance zone before entering long positions. Your initial target would be 58300, with a stop-loss just below 57500.
- Bears (Testing the range): Could look for short entries on any bounce that fails near the 57800 resistance, with a tight stop-loss just above 58000 and an initial target of 57100. A break below 57100 would be a more confirmed sell signal, targeting 56000.
Disclaimer: This technical analysis is for informational purposes only and does not constitute financial advice. Trading involves risk, including the loss of principal. Please conduct your own research or consult a professional financial advisor before making any trading decisions.
for more updates join our whatsapp group https://chat.whatsapp.com/Jrj3abV2S945BqYiQzOdk9